Why does a typical ecommerce site take seven seconds to load?
Tammy Everts on how many sites fail to implement basic performance-enhancing techniques
The first-ever broad study of European ecommerce websites has found that one in three of Europe’s top retail sites fail to meet the performance demands of online shoppers.
While web performance has gained traction in North America over the past few years, it's still an emerging topic worldwide, making it a challenge to convince site owners outside the U.S. that performance is a critical business issue.
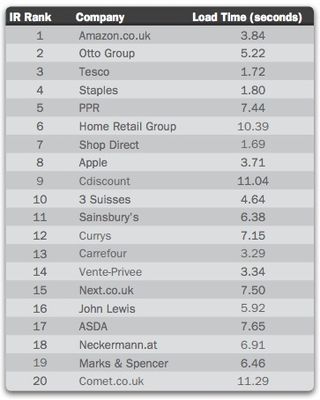
My company Radware studied the page speed and composition of 400 top European retailers, as ranked by Internet Retailer magazine, to see how these sites performed for visitors using Chrome 23 - the most popular browser in the EU at the time of testing - via the test server in Amsterdam. (We chose the Amsterdam location because it allowed us to test across all major browsers.)

While our findings, which were released in this report, may not be shocking if you’ve been paying close attention to the performance space, they may come as an eye-opener to other retailers.
Finding 1: most web pages are too slow
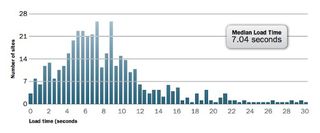
The median load time for first-time visitors was 7.04 seconds. Depending on who you ask, the average internet user expects web pages to load in less than three seconds, two seconds, or even 400 milliseconds. The last time the average person reported being OK with a seven-second wait was circa 2001.

Finding 2: one in four sites took over 10 seconds to load
If you take a closer look at the histogram above, you’ll get a more nuanced picture of how many sites fared. A significant number of sites performed much more poorly than 7.04 seconds. A total of 24 per cent of sites took more than 10 seconds to load while 8 per cent took 15 seconds or more.
Finding 3: pages are slow because they contain a lot of resources
The median IR 400 site had 76 resource requests, including CSS, JavaScript and image files. But, as with the load time results, this median number gives only a partial understanding of the resource issue. It’s important to note that one out of three pages contained over 100 resource requests.
Each of these resources represents one server round trip that's needed to pull all the page’s resources to the user’s browser, and each of these requests poses a small latency penalty. More round trips typically equals more latency and increased page render times.
Images and third-party scripts are the primary contributors to page bloat. Images account for more than half of a page’s total payload, while third-party scripts, such as ads, page analytics, and social sharing buttons, are the fastest-growing area of page growth.
Finding 4: many leading sites have failed to implement core performance best practices
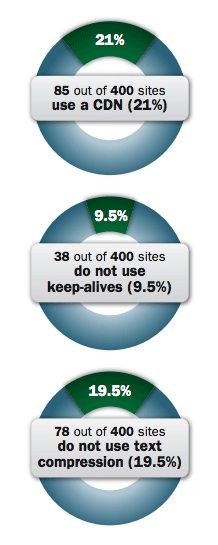
Four out of five sites don't use a CDN, despite the benefits of doing so: CDNs cache page resources closer to end users, allowing resources to make shorter round trips and speed up rendering.
We also found that many sites were missing out on opportunities to make their pages faster through two core performance techniques:
- Text compression – one in five sites failed to implement compression
- Keepalives – one in 10 sites didn't use keepalives
Text compression and keepalives are considered “low-hanging fruit” on the performance optimisation tree. Implementing both can improve start render time by up to 52 per cent and load time by up to 31 per cent. You can learn more about these techniques here.
Get the Creative Bloq Newsletter
Daily design news, reviews, how-tos and more, as picked by the editors.

Why you should care about these findings
I may be pointing out the obvious, but I’ll say it anyway: internet user expectations are universal. Users in the EU don't have lower performance expectations than users in North America. These findings should be a wake-up call for European site owners. (Not that North American site owners should rest easy. Last fall, we found that the median US commerce home page took almost seven seconds to load.)
As the first-ever broad survey of major ecommerce sites, this report can be used as a lever for introducing the topic of performance optimization within your organisation. It will also serve as a benchmarking device as we continue to measure and track European ecommerce performance.
Questions or comments?
Download the free report and let me know what you think in the comments or via email.

Thank you for reading 5 articles this month* Join now for unlimited access
Enjoy your first month for just £1 / $1 / €1
*Read 5 free articles per month without a subscription

Join now for unlimited access
Try first month for just £1 / $1 / €1
The Creative Bloq team is made up of a group of design fans, and has changed and evolved since Creative Bloq began back in 2012. The current website team consists of eight full-time members of staff: Editor Georgia Coggan, Deputy Editor Rosie Hilder, Ecommerce Editor Beren Neale, Senior News Editor Daniel Piper, Editor, Digital Art and 3D Ian Dean, Tech Reviews Editor Erlingur Einarsson, Ecommerce Writer Beth Nicholls and Staff Writer Natalie Fear, as well as a roster of freelancers from around the world. The ImagineFX magazine team also pitch in, ensuring that content from leading digital art publication ImagineFX is represented on Creative Bloq.
