This stunning WebGL site uses Twitter to measure a city's happiness
A machine learning sentiment API lets the Happy Forecast calculate the social wellbeing of London.
By using extensive university research, the Shoreditch-based independent creative agency Clubhouse Studios has produced this interactive map of happiness in London.
Check out these amazing examples of WebGL in action
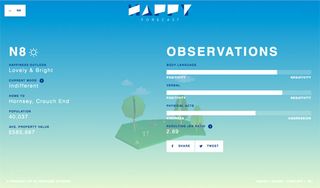
With the Happy Forecast, Londoners simply select their postcode for an idea of how happy their area is. By comparing the amount of positive Tweets against the negative ones, a live analysis of the region's mood is is calculated. This data is then displayed like a traditional weather forecast.

Cheerful places are brought to life with sunshine and green trees, while less happy places summon lightning bolts and grey skies. Scores are ranked by body language, verbal interactions and acts of kindness or violence.
How it works
Firstly, the site measures the current mood of the area by analysing the social sentiment of tweets in real-time. Dan Coppock, co-founder of Clubhouse Studios, explains how it works. "We're scraping Twitter's API for tweets based on geo-coordinates mapped from Google relating to each postcode. We analyse the Tweets using a machine learning sentiment API called Sentiment140, developed by Stanford computer scientists, which we were able to use because The Happy Forecast is a not-for-profit project.
"The machine learning algorithm classifies tweets into positive, negative and neutral gradings based on their content. While machine learning is the most intelligent way of measuring sentiment, it can sometimes miss positive comments if the context isn't right, so of those classified by Sentiment140 as 'neutral', we wrote an engine to do a second sweep based on natural-language keywords. Anything it finds was initially classified wrong, it adds to the positive and negative groupings for a robust real-time picture of sentiment in the area.
"The realtime element offers another dimension to the Happy Forecast. For example, in SW19 (Wimbledon) yesterday, we tracked a drop of 8% in positive Tweets from the area in the hour after Andy Murray finished his match, showing what a patriotic bunch we all are!"

Happy Forecast also compares house prices in the area to the behaviour of the communities moving through it. Coppock says: "One thing we wanted Londoners to take away from the site is that the way we interact with each other in public spaces matters. When looking for somewhere to live the important things to people are usually house/rent prices, resale values, transport links etc, but what these don't tell you is what it's like to live in these places or the communities that inhabit them.
"In addition to the observational data we collected, the site uses Zoopla's open API to display an up-to-date average property price for each postcode. It's interesting to see the juxtaposition between house prices and what we witnessed based on the people moving through each space. Higher prices certainly don't guarantee nicer interactions!"
How the site was made
"The core of the site (the 3D environment) is built in WebGL and Three.JS," continues Coppock. "We created the Origami-style 3D models in CAD software Maya to give our designers complete creative freedom with the modelling and animation style.
"In order to get those files to talk to the web browser we wrote an engine to strip each model apart by its UV and facias, as well as read the keyframe animations. This allowed us to create the exploding map transition and design all of the 119 forecast scenes.
"The site can read raw 3D files and manipulate them as smoothly as if they were simple CSS sprites. The custom engine to do that was a project in itself."
Head to the Happy Forecast to try it out.
Liked this? Read these!

Thank you for reading 5 articles this month* Join now for unlimited access
Enjoy your first month for just £1 / $1 / €1
*Read 5 free articles per month without a subscription

Join now for unlimited access
Try first month for just £1 / $1 / €1
Get the Creative Bloq Newsletter
Daily design news, reviews, how-tos and more, as picked by the editors.
The Creative Bloq team is made up of a group of design fans, and has changed and evolved since Creative Bloq began back in 2012. The current website team consists of eight full-time members of staff: Editor Georgia Coggan, Deputy Editor Rosie Hilder, Ecommerce Editor Beren Neale, Senior News Editor Daniel Piper, Editor, Digital Art and 3D Ian Dean, Tech Reviews Editor Erlingur Einarsson, Ecommerce Writer Beth Nicholls and Staff Writer Natalie Fear, as well as a roster of freelancers from around the world. The ImagineFX magazine team also pitch in, ensuring that content from leading digital art publication ImagineFX is represented on Creative Bloq.
