How to debug performance in the browser
Browser-based developer tools have become a vital part of the dev armoury; here's how you can use them to fix performance issues.

Every browser now comes with its own built-in set of developer tools, and they've quickly become an indispensable part of the developer toolkit, enabling you quickly test your responsive web design and pinpoint problems with your mobile website. They can also be used to break down your site's performance so that you can easily diagnose and fix issues that are slowing your site down.
The Timeline panel in Chrome and Opera and the Performance panel in Firefox and Edge provide detailed views of the frontend performance of your page, mapping a recorded timeline of events against the frame rate, CPU and memory usage.
To reduce the amount of data collected, each recording should focus on a particular action or event. So if we want to test our navigation menu opening and closing, we should avoid scrolling the page during our test.
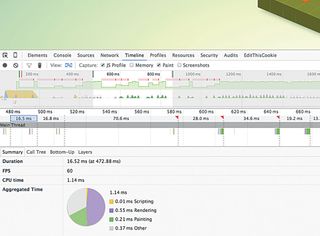
The overview of the captured recording displays a number of useful charts (see image above). You can focus in on different things by selecting and highlighting part of the chart.
- The top green chart displays our frames per second (higher values represent higher FPS). In Chrome and Opera, the red blocks above the chart indicate where drops in the frame rate and juddering (jank) occur
- The bar chart below shows the network requests, with lighter areas representing response waiting times and darker areas representing transfer times
- In Chrome and Opera, the area chart shows what CPU resources were used during the events. If the Screenshot option is checked, we can see a breakdown of how the page displayed during the test. Checking the Memory option shows how memory is handled
In addition to the overview, a waterfall chart shows the operations laid out sequentially, while the flame chart (toggled in Chrome and Opera using the View option) shows the call stack. Clicking an item in these charts displays a breakdown of the time this operation took.
This performance information can help us locate code that is causing delays as well as showing bottom-up scripts.
This article originally appeared in net magazine issue 280; buy it here!
Get the Creative Bloq Newsletter
Daily design news, reviews, how-tos and more, as picked by the editors.

Thank you for reading 5 articles this month* Join now for unlimited access
Enjoy your first month for just £1 / $1 / €1
*Read 5 free articles per month without a subscription

Join now for unlimited access
Try first month for just £1 / $1 / €1
