Create custom Google Maps using Drupal
Dave Myburgh shows you how to create a custom global event map from location data stored in Drupal.
When we decided to update Acquia’s training website to Drupal 7, we wanted to have a map on the event page showing the locations of all our upcoming courses, as well as a map for each course, so users can quickly get a feel of where events will be taking place. Visitors can also open up the maps in Google Maps to obtain directions.
In the past, it’s been difficult to create maps from location data stored in Drupal. There are numerous modules and methods available to deal with this, but finding the right combination can be tricky. For the training site, we figured out how to make it all happen using the following three modules (along with any other modules they require):
In this walkthrough, I’ll show you how we used these modules to generate custom event maps. I’ll begin by configuring each module, using IP Geolocation Views & Maps to collect location data from the site’s visitors, then creating a global map that shows the location of upcoming events along with a pin indicating the location of the viewer.
You can take a look at the results here.
Step 01
First, you need to enable the following modules: Location, Location CCK, GMap, GMap Location and IP Geolocation Views & Maps (IPGV&M). There will be some dependencies that are required – for example, Views – so go ahead and enable those too.
Step 02

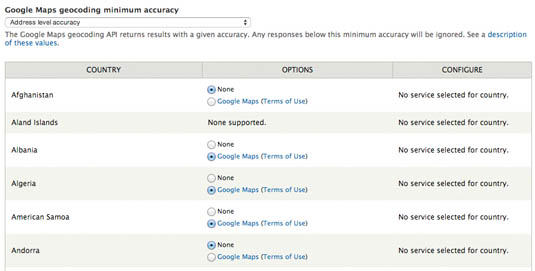
Go to Admin > Config > Content > Location and configure the Location module. Under Main Settings, we enabled the Open map link in new window option and left the Map Links tab alone. On the Geocoding Options tab, we selected Address level accuracy from the Google Maps geocoding minimum accuracy dropdown. We also ticked the Google Maps button for each country we run courses in. If you add an event in a new country, you must come back here and enable geocoding for that country.
Step 03
To configure the GMap module, go to Admin > Config > Services > Gmap, where you’ll enter your Google Maps API key. Enter the map defaults you want to use. We used a default width of 350px, a default height of 160px and no default centre, to fit in with our design for the event pages. The Marker action option can be set to Open info window, so that users get a pop-up when they click the marker.
Get the Creative Bloq Newsletter
Daily design news, reviews, how-tos and more, as picked by the editors.
Step 04
The IPGV&M module enables you to collect location information from your users. When they visit a page with a map on it, their location can be shown on that map and used to give directions to an event. Go to Admin > Config > System > ip_geoloc to configure it. We checked Employ the Google Maps API…, along with Employ Smart IP… as a backup. We also entered the URLs where we wanted to collect user location data: all the event nodes and the main events landing page. We left the other options on their defaults.
Step 05

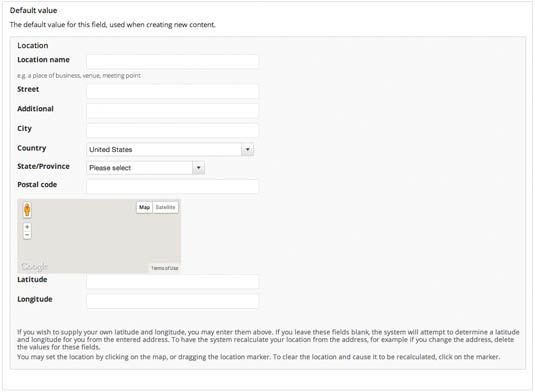
We wanted to show a Google map of the event location on each event node. The Location module can be used to create a location field that takes an address and geocodes it to a latitude and longitude for display on the map. We didn’t set any defaults in the Default value settings, to prevent empty maps appearing if no location data is entered – for example, for an online event.
Step 06
In the Collection settings, we chose to Allow collection of the following elements for a location: Location name, Street location, Additional, Country, City, State/Province (choosing Dropdown from the second menu), Postal code, and Coordinate Chooser (this allows the editor to enter a latitude and longitude if geocoding fails for some reason). In Display Settings, we ticked: Coordinate Chooser, Province name, Country name and Coordinates. The GMap Macro is simply set to [gmap] and our GMap marker is Blue.
Step 07
On the Manage Display tab for the event content type, select Address with map as the Format for the Location field. Now when viewing an event with an address, you will see the actual address as well as a map of the location. A link to Google Maps is provided below the map so users can interact with it – for example, to get directions from their location.
Step 08
If a map does not appear after saving an event, go back and edit the node to ensure that a latitude and longitude are now visible below the location data. If not, you might need to enable geocoding for that country, or manually enter the latitude and longitude. If that doesn’t work, double-check all the settings above. As a last resort, check the issues list for that particular module on the Drupal site to see if you can get some help there.
Step 09

The last thing we need to do is create a display that shows all our events across a world map. We can do this using the Views module, in conjunction with the IPGV&M module. Views is one of those ubiquitous modules that tends to be used on all but the very simplest websites. It is required by IPGV&M, so you should already have it enabled at this point.
Step 10
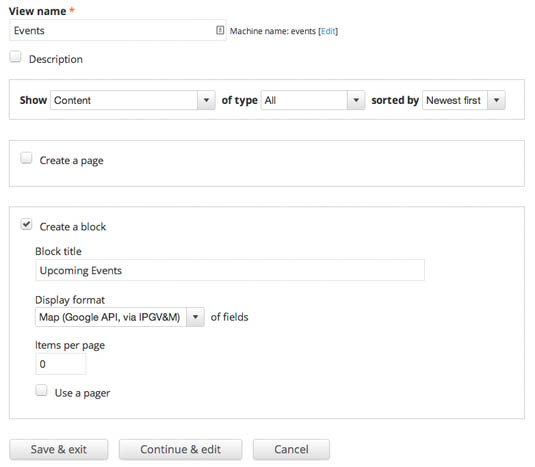
Create a new View (Admin > Structure > Views > Add) and check Create a block with the Display format set to Map (Google API, via IPGV&M). In the settings for this option, you’ll see dropdown selects for the latitude and longitude fields. If you’ve already added those fields to your field list in the View, select them; otherwise leave them blank for now – you can add them after you’ve added the fields. Leave the Default location marker set to default.
Step 11
Map options is where the tricky stuff comes in. You really have to play around with the options in order to get your desired outcome. We used the following:
{"mapTypeId":"roadmap",
"disableDefaultUI":true, "zoom":2,
"zoomControl":true, "scaleC
ontrol":true,"centerLat":20,
"centerLng":-30}
In Map style (CSS attributes) add CSS styles for the map itself: here, we’re using height: 400px;width: 100%. Select Center the map on the visitor’s current location from Map centering options and enter a hex colour code (without the #) for the user’s icon colour.
Step 12
Add Location: Latitude and Location: Longitude fields to the View. Be sure to set these fields to Exclude from display. Then add whatever other fields you want to show in the pop-up when someone clicks on the marker on the map: for example, Content: Title, Content: Date, Location: City and so on. We added a filter to the View to show only event nodes that had a start date in the future (Content: Date (start date) > now).
Step 13
Save the View and add the block where you want it to show on your site. You can see our map here.
This article originally appeared in issue 259 of net magazine.
Words: Dave Myburgh
Liked this? Read these!
- 11 superb examles of Drupal websites
- Free tattoo fonts for designers
- The ultimate guide to logo design

Thank you for reading 5 articles this month* Join now for unlimited access
Enjoy your first month for just £1 / $1 / €1
*Read 5 free articles per month without a subscription

Join now for unlimited access
Try first month for just £1 / $1 / €1

The Creative Bloq team is made up of a group of art and design enthusiasts, and has changed and evolved since Creative Bloq began back in 2012. The current website team consists of eight full-time members of staff: Editor Georgia Coggan, Deputy Editor Rosie Hilder, Ecommerce Editor Beren Neale, Senior News Editor Daniel Piper, Editor, Digital Art and 3D Ian Dean, Tech Reviews Editor Erlingur Einarsson, Ecommerce Writer Beth Nicholls and Staff Writer Natalie Fear, as well as a roster of freelancers from around the world. The ImagineFX magazine team also pitch in, ensuring that content from leading digital art publication ImagineFX is represented on Creative Bloq.
