Create an SVG data visualisation with PHP
Using code to create beautiful visualisations saves time, effort and allows you to focus on the idea rather than implementation details. Brian Suda explains how he wrote a PHP script to build an SVG graphic based on the .net magazine covers
A good programmer is a lazy programmer. In a growing world of data visualisations, handcrafting each design won't scale. I wanted to see if there was a way to create aspects of visualisations using a program, to make the output easy to create and reusable. Much like the UNIX philosophy of loosely joined programs, was it possible to build up a small toolbox of loosely joined scripts that create building blocks of visualisations?
There doesn't seem to be an accepted term for this. I have heard the phrases "deterministic design", "programmatic design" and "computational design". What they are all aiming for is the ability to consistently create some graphic element based on data input.
We see this in the real world all the time. The old mercury thermometers took data from the environment, the temperature, and converted that into a visualisation by moving the mercury up the pipette. What is the digital equivalent?
There are a few candidate technologies. If you’re working online, then canvas springs to mind. It allows you to draw raster graphics quickly and easily. If you want, there are also plenty of image code libraries that can generate GIFs, JPEGs and PNGs on request. But what if your target isn't always online? What if you’re aiming for print? Then you could use a raster graphic, but it would need to be pretty large. A better solution is to create a vector-based image format from your code. This is where SVG (Scalable Vector Graphics) steps in.
What is SVG?
SVG is the little technology that could! It is over 10 years old and the specification is still being refined. SVG was designed and redesigned with an XML web in mind. SVG Tiny was set to take the mobile world by storm, but it never did. The web would have zoomable graphics that could scale with your responsive web design, but few browsers natively support SVG. Looking around, you'd think that SVG failed and is a write-off. The web's loss is a programmer's gain!
SVG is an XML-based language used to describe vector graphics. There are a handful of primitives that you need to know, like line, circle, rectangle and path. From these you can build up much more complex images. Since XML is just text, you can write an SVG file in any text editor. Even simple programming scripts can quickly output SVG. Since the format is text, it’s possible to get in and tweak it even after your code is done... If you don't like the colour, then open up Notepad and find and replace it.
SVG is a beautifully simple thing to learn. For many years I never got into programming graphics because you needed to know about image formats and it was like a foreign language, but with SVG it's just text. The web won because you could "View Source"; SVG is a great image format because you can do the same!
Using code to build SVG
Building up SVG from code has its advantages. You can mathematically produce exacting results each time. Using algorithms you can quickly space out objects at exact intervals. I've seen designers try to snap objects to lines or use the rules to measure out distances, only to zoom way in, check it, zoom way out and still have it off my sub-millimetre tolerances. In code, this can all be ignored. Incredibly complex curves can be explained away with a few lines in a path and best of all, it is reproducible over and over again. Generating 10,000 random dots in a script is one for loop. By hand, this would take lots of copying and pasting and then it wouldn't be truly random. The power of code to quickly generate designs that are either too exacting or too tedious for designers is the sweet spot.
I'm not advocating taking away the design of any graphics from the professionals, but rather letting code do what it does best. A good programmer is a lazy programmer. A good designer should be lazy. There is no need to create 10,000 random dots by hand. Your time could be used in much better ways.
Building up SVG via code is the quickest way to get a base that can easily be imported into more complex vector software such as Adobe Illustrator or Inkscape. From there, the design can be shaped further to match the needs of each unique project.
Examples
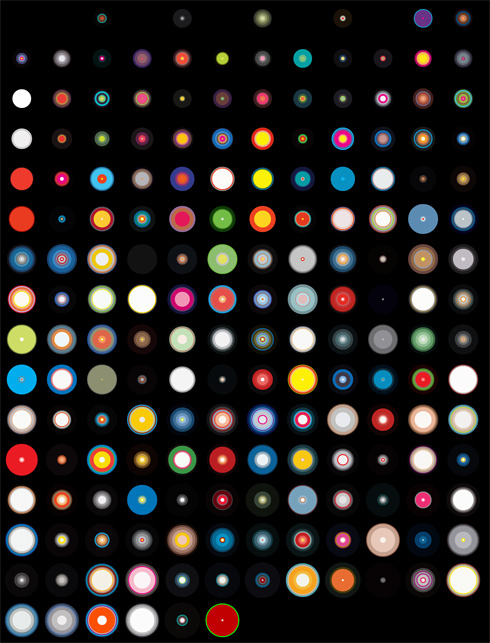
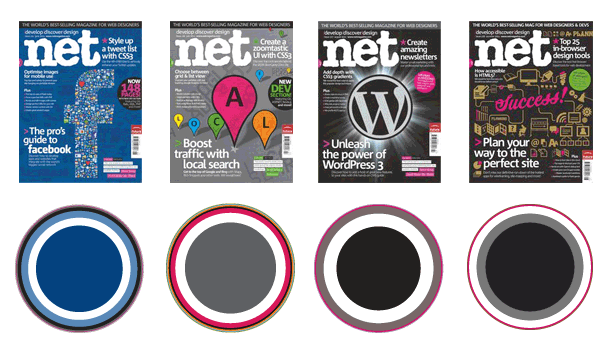
If we take an example, things will be much clearer. I see great designs all around and wonder how they did it and how, or if, it could be done in code. One of my favourites is this poster for WIRED magazine's 15th anniversary. In its own right it is a beautiful thing to look at, but until you understand it, you don't get the subtle reference. Each of the colour wheels represents the major colours of each issue's cover. You can see over time how they went through dark periods and bright coloured periods. I thought to myself how I might go about doing something like this and wrote a simple PHP script that would take a .net magazine cover and produce a similar effect.

Making the .net covers visualisations
For those of you not familiar with PHP, SVG or how to view them, it is pretty easy. I'll walk you through the code and show you how to view SVG in the browser and in a text editor. If you want to use your own favourite language, it shouldn't be hard to follow along.
The first thing we need to do is load up the JPG image we want to analyse. In PHP, you can use the imagegreatefromjpeg() function if you have the proper libraries installed. This returns an image handle so we can ask further question about the graphic.
The next thing we'll do is get the height and width of the image by using imagesx() and imagest() functions.
Our goal is to look up every pixel colour in the image and count the frequency of each. So we'll need some sort of array. In this case, I created an array called $rgb = array(), which I can make a new key for each colour and increment the value as a counter.
Since we have the height and width of the image, we can make two nested for loops. We can now go column by column looking at each x and y pixel by using the imagecolorat() function. The line $rgb[imagecolorat($im, $i, $j)]++; is accessing the rgb array, at the key equal to the pixel value, and adding one to that value. When the two for loops are finished we will have looked at every single pixel, making a nice, compact array of just the known colours and their frequency.
Finally, we'll sort this array with asort() so the most popular colours are at the end and the smallest values at the start.
The code in PHP looks like the following:
<?php// Fetch the JPEG image from a file$im = imagecreatefromjpeg("213.jpg");// Get the height and width based on the x,y values$x = imagesx($im);$y = imagesy($im);$rgb = array();$counter = 0;$scaler = 10;// get colour count frequency by looping through the image column by columnfor($i=0;$i<$x;$i++){ for($j=0;$j<$y;$j++){ // get that pixel's RGB value and store it in an array $rgb[imagecolorat($im, $i, $j)]++; }}// Sort the arrayasort($rgb);// release the image from memoryimagedestroy($im);?>At this point our $rgb array is full; we no longer need the source image and we are going to create a new visualisation in SVG based on the data.
SVG is XML-based, which means it is just text. So we can simply echo out SVG code and see the results. The first thing we should do it let the browser know that this is SVG rather than plain text. In that case we need to use the header() function with the appropriate content-type "image/svg+xml". Now browsers or other applications can use this to render it properly. It might work without this, but it’s better to be a good net citizen and output this if you can.
After that, we print out the XML declaration and SVG DOCTYPE.
Now we can actually start to get to the SVG part that’s specific to our image. Much like any HTML page has a root of <html>, SVG has a root of <svg>. This takes a few parameters such as the height and width of the final image. Since we don't always know how big our source image is going to be, it’s easier to just make this 100% for each value.
Get the Creative Bloq Newsletter
Daily design news, reviews, how-tos and more, as picked by the editors.

The logic for outputting the design is pretty simple. We will take the smallest occurring colour value in the image and make a circle that’s equal to the height times the width.
It doesn't seem intuitive that the largest possible circle is the smallest possible value! What we do next will help clear this up.
This large circle is our base layer. We’ll put this down first and we'll stack additional circles on top of this, getting slightly smaller each time. In the end, the only thing visible from our huge starting circle will be a tiny sliver around the edge.
To accomplish all this, we'll loop through the $rgb array extracting the key, which is the colour, and the value, which is the frequency. We can do this with foreach($rgb as $k=>$v). The next few lines split the RGB value into an $r, $g, $b value ready for converting to hex. In PHP you have dechex() function, which takes a decimal number and creates a hex equivalent. We also need to pad the string with leading zeros in case the colour value is less than 16. Putting them altogether we get the $hex value.
Up until this point, we haven't even outputted any SVG graphical element. This will be our first, a circle. In SVG to make a circle, you use the <circle> element with some attributes. These attributes describe both the circle and its position. The attributes cx and cy are the circle's centre point on the x,y grid. The attribute r is the radius and fill is a hex colour that you want the circle to be filled with. Making graphical elements couldn't be much easier.
Now we need to take what we've learned and apply it to our array of colours. There are two variables we need to keep track of: the maximum size of the circle and the size of the previous circle. Also, to make sure things don't get out of hand size-wise, I’ve added a $scaler variable to keep the size from exploding too large.
The variable $c is the maximum size that we will continually decrease the radius from. Since $c is the width times the height, every pixel in the original graphic is represented in the radius of the circle. The next variable $prev is the size of the previous circle we drew. That way, we can slowly decrease the size of the radius based on the number of pixels we’ve made circles for already.
<?phpheader('Content-Type: image/svg+xml');echo '<?xml version="1.0" standalone="no"?><!DOCTYPE svg PUBLIC "-//W3C//DTD SVG 1.1//EN""http://www.w3.org/Graphics/SVG/1.1/DTD/svg11.dtd"><svg width="100%" height="100%" version="1.1"xmlns="http://www.w3.org/2000/svg">';$c = (int)(($x*$y)/$scaler);$prev = 0;foreach($rgb as $k=>$v){ if($v > 0) { $r = ($k >> 16) & 0xFF; $g = ($k >> 8) & 0xFF; $b = $k & 0xFF; $hex = str_pad(dechex($r),2,'0',STR_PAD_LEFT).str_pad(dechex($g),2,'0',STR_PAD_LEFT).str_pad(dechex($b),2,'0',STR_PAD_LEFT); echo '<circle cx="'.$c.'" cy="'.$c.'" r="'.($c-$prev).'" fill="#'.$hex.'" />'; echo "\n"; $prev += (int)($v/$scaler); }}echo '</svg>';?>
If we look at some example output we will quickly see that every tiny shade of each colour gets its own ring. This means anti-aliased text creates plenty of shades of grey that we should collapse into a single representative colour. This will reduce the number of rings, but at the same time it is clearer which colours stand out the most. We could simply take the top five most popular colours, but what normally happens is you get similar shades of the same colour rather than representing the full spectrum. A better way is to try and promote colours with similar values into the most popular neighbour. To do this, we need to write a simple function which we insert before the SVG output.
$rgb = reduceColors($rgb);Passing in the list of $rgb colours we get their value and frequency. The idea is to loop through this full list and create a new list with the reduced colours. I have chosen a plus or minus range of 75. This means an RGB value of 100,100,100 would get promoted into the most popular colour, which is anywhere from 25,25,25 to 175,175,175. You can adjust this value to be more forgiving or more strict. Depending on your values, you will end up with more or less rings.
First, we need to reverse sort the array so the most popular colours are first. This means we are promoting into the most popular rather than down to the least. As we loop through the $rgb array, we also need a sub-loop through the $temp array. If this is a new colour we haven't seen before, we put it into the new $temp array. Otherwise, as we loop through we can add it to the first $rgb value that we find matching our plus/minus range. At the end, we resort the array so the smallest is first and return it back so we can output the SVG.
function reduceColors($rgb){ $plusminus = 75; arsort($rgb); $temp = array(); // do colour merger foreach($list as $k=>$v){ if($v != 0){ $r = ($k >> 16) & 0xFF; $g = ($k >> 8) & 0xFF; $b = $k & 0xFF; $matched = false; foreach($temp as $m=>$n){ if($m != $k){ $rs = ($m >> 16) & 0xFF; $gs = ($m >> 8) & 0xFF; $bs = $m & 0xFF; if ( ($rs <= ($r+$plusminus))&&($rs >= ($r-$plusminus)) && ($gs <= ($g+$plusminus))&&($gs >= ($g-$plusminus)) && ($bs <= ($b+$plusminus))&&($bs >= ($b-$plusminus)) && $matched == false ) { $temp[$m] += $v; $matched = true; } } } if(!($matched)){ $temp[$k] = $v; } } } asort($temp); return $temp;}Instead of using the function, another option would be to use the built-in function imagetruecolortopalette(), which can take a maximum number of colours for the colour palette. This will fix the number of possible colours in the rings and do the colour reduction for you. The results may or may not be what you intended, but it is an easier alternative.

Improvements
There are plenty of ways this could be improved. A better colour clustering algorithm, some optimised looping, maybe invert it so the most popular colours are on the outer ring instead of the inner. This was designed as just a quick starter into the world of dynamically generated visualisations. From here on, you need to take your creativity and see what you can apply it to.
SVG is hardly the scary technology that you might have thought. Given that it is simply an text, XML format, you can write scripts in your favourite language to quickly and easily generate output. Running these scripts on different data produced different output, but the underlying code remains the same, allowing you to quickly and easily prototype new designs. Knowing SVG and how to script its output is another tool in your toolbox useful in many aspects at work and play.

Thank you for reading 5 articles this month* Join now for unlimited access
Enjoy your first month for just £1 / $1 / €1
*Read 5 free articles per month without a subscription

Join now for unlimited access
Try first month for just £1 / $1 / €1

The Creative Bloq team is made up of a group of design fans, and has changed and evolved since Creative Bloq began back in 2012. The current website team consists of eight full-time members of staff: Editor Georgia Coggan, Deputy Editor Rosie Hilder, Ecommerce Editor Beren Neale, Senior News Editor Daniel Piper, Editor, Digital Art and 3D Ian Dean, Tech Reviews Editor Erlingur Einarsson, Ecommerce Writer Beth Nicholls and Staff Writer Natalie Fear, as well as a roster of freelancers from around the world. The ImagineFX magazine team also pitch in, ensuring that content from leading digital art publication ImagineFX is represented on Creative Bloq.
