JavaScript debugging for beginners
Frontend developer David Smith outlines a few of the key features of modern developer tools that can aid JavaScript debugging in your website or application.
- Knowledge needed: Basic JavaScript
- Requires: Web browser, one of: Google Chrome, Firefox (with Firebug) or Opera
- Project time: 30 mins
Over the last five years, thanks largely to the rise of frameworks such as jQuery and Prototype, JavaScript has risen to become a first tier language for scripting on the web. This increased popularity and ease of use, has led to the creation of fully fledged applications such as Gmail, which contain thousands of lines of JavaScript code that required teams of talented developers to create.
As a result of this increasing complexity however, when something does go wrong developers need powerful JavaScript debugging tools in order to quickly root out the cause of the issue and fix it efficiently. A simple var dump via the alert() dialogue simply won’t cut it anymore.
In this tutorial I’ll outline some of the features of modern developer tools that you can use today to help make JavaScript debugging less painful. We’ll focus primarily on the Chrome developer tools and Firebug but many of these features are available in other tools such as Opera Dragonfly.
- Read all our web design articles here
01. The Console – an overview
In most developer tools your best friend is the Console; a multiple purpose panel utilised for error logging, inspection of the DOM, JavaScript debugging and much more. Depending on your browser, it’s simple to launch this panel at any time using:
- Chrome dev tools and Opera Dragonfly – Ctrl + Shift + I
- Firebug - F12
To aid you with debugging scripts, the console panel will automatically display any errors in your code which occurred during execution. A file and line number are provided next to each error and clicking the message will jump to that line for inline JavaScript debugging – handy!
No more alerts() – logging data to the console
The console isn’t just for passively displaying errors however. It also responds to commands you pass to it via the Console API and the Command Line API. Perhaps the best known and most helpful tool is the .log() command.
When writing any form of code it’s helpful to be able to print the value of a variable in order to inspect it. In times gone by a developer might have used the alert() dialogue to provide a visual print out.
Get the Creative Bloq Newsletter
Daily design news, reviews, how-tos and more, as picked by the editors.

Nowadays a better solution is the console.log method which prints the value passed to it to the Console panel like so:
dquo;); // prints “Captain’s Log” on the Console panel
We might use this to print the value of a calculated variable. For example:
function calcPhotos() {
total_photos_diff = total_photos - prev_total_photos;
// Log to the Console
console.log(total_photos_diff);
}
The benefit of this approach over the use of the alert() dialogue is that code execution is not halted and therefore we can print the result of a variable multiple times and watch it change without requiring intervention.
var t = 3,
p = 1;
function calcPhotos(total_photos, prev_total_photos) {
var total_photos_diff = total_photos - prev_total_photos;
// Log to the Console
console.log(total_photos_diff);
// Update values
t = t*1.3;
p = p*1.1;
}
setInterval(function() {
calcPhotos(t,p);
},100);
02. Distinguishable logging
In the example above the loop causes many variables to be logged to the Console. It’s easy to see how quickly it becomes visually overwhelming if lots of variables are dumped.
Many people are aware of the standard log function, but it’s also useful to know that there are other Console API commands which allow you to distinguish between different types of data being logged to the Console. Perhaps most useful of these are:
console.info(): provides a visual "info" icon and colour coding (blue) to denote a “Info” log call. Useful for denoting when something important is about happen

console.warn(): provides a visual "warning" icon and colour coding (yellow) to denote a “Warn” log call. Useful to log when something is going outside an acceptable range

console.error(): provides a visual "error" icon and colour coding (red) to denote a “Error” log call. Useful for denoting when something has caused an error condition which you need to highlight

Note: Chrome dev tools don’t currently provide any visual distinction between the different types of logging.
03. Grouping related log calls
Using alternative logging calls provides a semantic and visual distinction between the information being printed into the console and can aid readability. We might still hope to improve this further by grouping our error messages into blocks of related calls. We can do this using console.group():
// Start 1st Grouping
console.group("Photo calculation");
console.info("Total difference is now " + total_photos_diff);
console.log(total_photos_diff);
console.groupEnd(); // end group
// Start 2nd Grouping
console.group("Incrementing variable");
console.log("Total photos is now: " + t);
console.log("Prev total photos is now: " + p);
console.groupEnd(); // end group
This produces a grouped output in the Console. The visual representation is different in different tools. Here’s how it looks in Opera Dragonfly:

The examples above just scratch the surface of what’s possible with the Console API. There are many other useful commands available to you. I recommend reading through the Firebug official Wiki page for a list of commands, although it’s worth noting that support across different tools isn’t necessarily universal.
04. Pausing script execution
Logging to the console is useful but things can quickly get out of hand if you code is executing quickly and you’re trying to keep track of multiple variables.
To make life easier we can use JavaScript debugging tools to pause code execution at a particular points, allowing you to assess the current code status at leisure. The most common way to pause code execution in modern dev tools is to use Break Points.
05. Working with break points
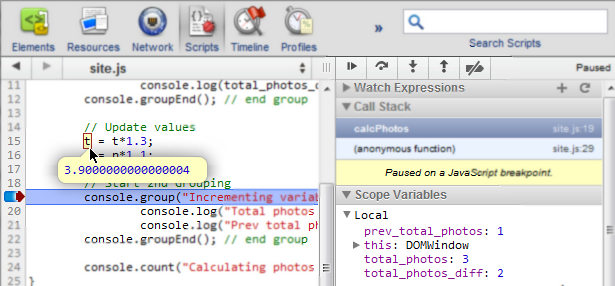
To set a break point navigate to the 'Scripts' tab and select the script you’re working on from the list. Now find the line where you’d like to pause execution and click in the margin to activate the breakpoint – a visual indicator should appear. Now reload the page and execution will be halted at the specified point:

With execution paused you can now hover your cursor over any variable and the debugger will bring up a tooltip with information about it’s value at the current time.
Once you’re ready you can then choose to continue code execution using one of the Execution Control Buttons which are usually located at the top of the side panels. The options available to step through the code are:
.jpg) “Continue”: continues code execution until another breakpoint is encountered.
“Continue”: continues code execution until another breakpoint is encountered.
 “Step Over”: steps through the code line by line so that you can see how each line effects the variables being updated. If your code calls another function the JavaScript debugging will not jump into its code. Instead it will be “stepped over” and the focus will remain with the current function.
 “Step Into”: similar to Step over, except that when you click “Step Into” at function call, the debugger moves its execution to the first line in the function definition.
 "Step Out": if you have stepped into a function definition by clicking Step Into button, clicking the Step out button causes the remainder of the function definition to be executed and the debugger moves its execution to its parent function.
As you step through, you can use the side panels to help you keep track of changes in your code’s state including updates to local, closure and global scope variables.
06. Conditional Breakpoints
As breakpoints stop code execution it is sometimes desirable to only have them fire when certain conditions are met. If your code uses a loop which fires every 50ms for example, you probably don’t want the debugger to halt on each iteration. We can avoid this using a
conditional breakpoint.

In the example above code execution will now only break when the total_photos_diff variable is greater than 200 saving us a lot of extra clicks in the debugger. To activate a conditional breakpoint, right click on the breakpoint in the margin and choose 'Edit Breakpoint' to reveal the conditional breakpoint dialogue.
07. Setting Breakpoints from code
It’s not always convenient or even desirable to set breakpoints using the dev tools interface.
Sometimes it’s just easier to launch the debugger directly from you code. This can be done via the use of the debugger keyword. The example below shows how you could pause code execution via a conditional statement in your code:
if (total_photos_diff > 300) {
debugger; // launch the debugger and pause execution
}
Other ways to pause execution
Besides setting breakpoints manually, developer tools also provide you with a number of opportunities to halt code execution depending on various scenarios.
08. Break on DOM mutation
If you’d like to debug a piece of code which is handling a DOM mutation, then developer tools provide a way for you to pause code execution when a DOM node changes.
Using the Elements panel, right click on the node which is being modified and you’ll be provided with a set of options to Break on DOM alteration. Reload and the next time the element changes script execution will halt.
You can keep track of which Breakpoints you have set using the DOM Breakpoints side panel.
09. Pause on all/uncaught exceptions
Most dev tools allow you to pause script execution when an exception is encountered. In Chrome dev tools this functionality can be toggled using the 'Pause' icon on the bottom row of the interface.

You can choose whether to break on all exceptions, or simply on those exceptions which aren’t handled by your script. The example below shows an uncaught exception and one which is 'caught' (handled via try/catch).
var t = 3,
p = 1;
function calcPhotos(total_photos, prev_total_photos) {
var total_photos_diff = total_photos - prev_total_photos;
// Start 1st Grouping
console.info("Total difference is now " + total_photos_diff);
// Update values
t = t+5;
p = p+1;
// Uncaught exception - will pause
if (total_photos_diff > 300) {
throw 0;
}
// Exception is caught via the try/catch
// Will only pause when "pause on ALL expections" is active
if (total_photos_diff > 200) {
try {
$$('#nonexistent-element').hide();
} catch(e) {
console.error(e);
}
}
}
setInterval(function() {
calcPhotos(t,p);
},50);
10. An introduction to the Call Stack
If you encounter an error in your script then pausing on exceptions will halt execution at the point in your code where the error was thrown. However what if it’s not obvious what has caused the error? What has led to the error occurring? How do we discover this information?
When script execution is halted you will notice the panels on the right hand side of the tools interface which provide a wealth of useful information, the most valuable of which is perhaps the call stack.
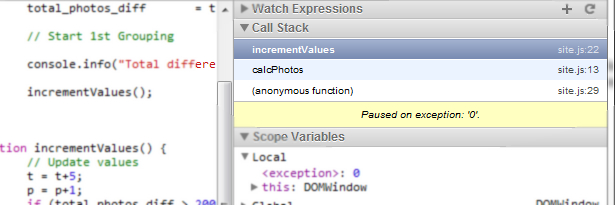
The call stack shows the full execution path that led to the point where code was paused providing you a birds-eye view of the code flow that led to the error.
In the example below I’ve intentionally thrown an error in the incrementValues() function which has brought up the debugger. The developer tools show the full call stack that led to the error, which allows me to step back through the code flow to determine any potential issues.

11. Further reading and resources
Hopefully the examples above have provided a useful overview of some of the methods at your disposal to make JavaScript debugging just that little bit easier.
However, this article outlines just a flavour of what can be accomplished. To learn more I thoroughly recommend spending some time with the following resources in order to really understand the true power of your developer tools:
- Firebug Wiki: Firebug is the original “developer tool” and it’s Wiki has a wealth of informationon the various API’s and tools available.
- Chrome Developer Tools docs: the Chrome dev tools docs provide a wealth of information on getting the most from their tools. Even the most experienced will learn something here.
- Video: “Chrome Dev Tools Reloaded”: filmed at Google I/O 2011, Paul Irish and Pavel Feldman provide a excellent overview of the power of the Chrome dev tools. A must watch!
- Opera Dragonfly Debugger docs: even if you don’t use Opera on a daily basis the concepts described in their documentation are applicable across most developer tools.
- Chrome dev tools cheatsheet: a handy print out for working with Chrome Dev tools.
Liked this? Read these!
- How to build an app
- Free graffiti font selection
- Illustrator tutorials: amazing ideas to try today!
- The ultimate guide to designing the best logos
- The best free web fonts for designers
- Useful and inspiring flyer templates
- The best 3D movies of 2013
- Discover what's next for Augmented Reality

Thank you for reading 5 articles this month* Join now for unlimited access
Enjoy your first month for just £1 / $1 / €1
*Read 5 free articles per month without a subscription

Join now for unlimited access
Try first month for just £1 / $1 / €1

The Creative Bloq team is made up of a group of design fans, and has changed and evolved since Creative Bloq began back in 2012. The current website team consists of eight full-time members of staff: Editor Georgia Coggan, Deputy Editor Rosie Hilder, Ecommerce Editor Beren Neale, Senior News Editor Daniel Piper, Editor, Digital Art and 3D Ian Dean, Tech Reviews Editor Erlingur Einarsson, Ecommerce Writer Beth Nicholls and Staff Writer Natalie Fear, as well as a roster of freelancers from around the world. The ImagineFX magazine team also pitch in, ensuring that content from leading digital art publication ImagineFX is represented on Creative Bloq.
