Discover the F12 developer tools in IE9
Katrien De Graeve, developer evangelist for Microsoft, explains how the F12 developer tools in Internet Explorer 9 make it a lot easier to hack your way through website issues
The developer tools that come with Internet Explorer 9 (F12 devtools as we call them affectionately) are a powerful aid to solving compatibility, network, script profiling and performance issues; debugging code; managing HTML and CSS; editing on the fly and validating markup; and last but not least inspecting HTML, CSS and JavaScript. Personally, the F12 devtools have already helped me a lot in understanding how some sites implement some of the new HTML5 features such as <canvas>, <video>, SVG and more.
Although the developer tools have been around in some form since Internet Explorer 7, with IE9 we get some real extra goodness. That includes things like the Network tab, which lets you see what is sent to the server, request headers, response body, response codes, inspect cookies, MIME types, Ajax and Activex calls, get information on the call initiator and much more. Other new additions are the Console tab and the User Agent string changer.
Enabling F12 developer tools
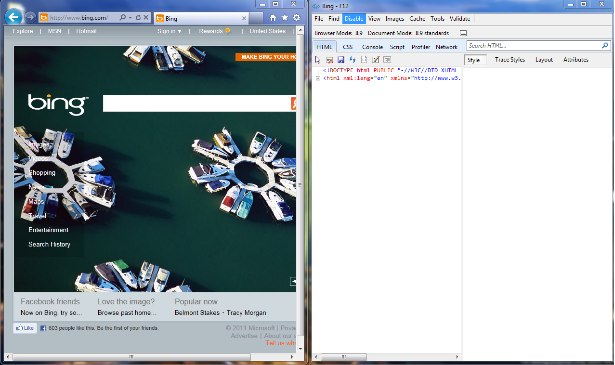
As you might expect, it’s as simple as pressing F12. Now that’s an easy one to start right? You may also use the Tools button and then choose 'F12 developer tools'. You can minimise to the bottom, pop out the window and use Windows 7 keys to align the IE9 and developer tools windows side by side (Windows key + left/right arrow).
Testing on multiple browsers
Every now and then we come across sites that seem to not be rendering well. Sometime it’s a site not optimised for IE9 standards mode, but sometimes it’s simply a site rendering badly in any browser. Here are a few tips on how F12 developer tools can help you test rendering in different IE versions and even act as another browser to the server.
User Agent string changer
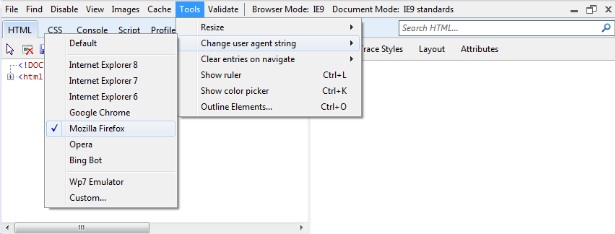
When coming across any site issues that I suspect are related to compatibility, the UA string changer comes to my rescue. It’s one of my favourite features in the devtools I might say. UA string or Browser mode impacts the UA string that is sent to the web server. Therefore, IE9 can act as another browser and receive another set of HTML and CSS code from the server.
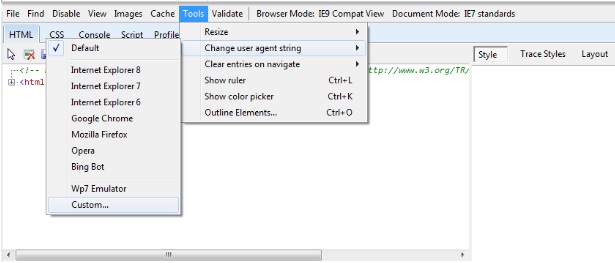
You can access it by choosing Browser Mode in the menu, or going to Tools > Change user agent string.
One of the sites I ran into that’s giving me a weird behaviour in IE9 is www.laredoute.be. Adding anything to the shopping cart returns a 500 error page from the server. This is not just rendering, something is really wrong here!
Get the Creative Bloq Newsletter
Daily design news, reviews, how-tos and more, as picked by the editors.
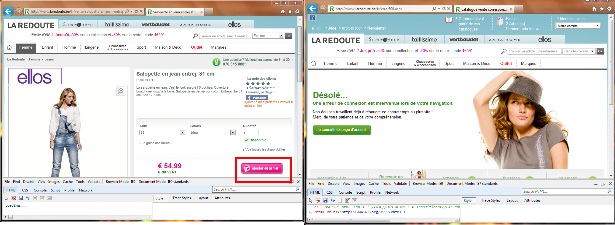
So, time to investigate with the UA string changer. For example I can force the server to send down content as if I was using IE7:

Or, maybe I can just check the same page as I was using Mozilla Firefox (or Google Chrome for that matter):
Sure enough, it’s not rendering causing the issue but really some kind of IE specific browser test that is failing. Reloaded the page set to Firefox UA string and now adding to the items to the cart is no problem any more!
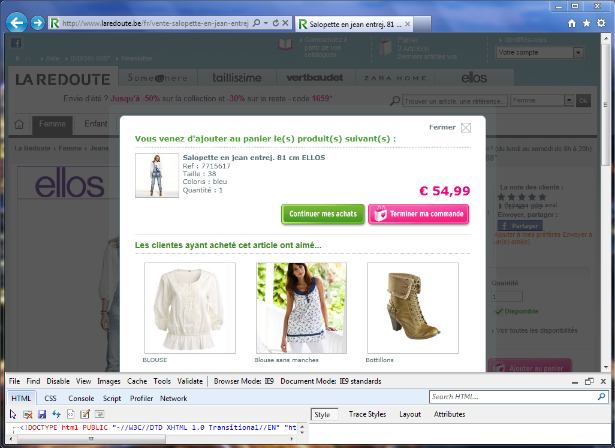
Hint: find what is causing the issue on IE9 by checking the Console tab…
You’ll notice browser detection code is often the culprit: UA string changer will allow you to pinpoint and find a solution.
Adding a custom UA string
You might have noticed I have a “WP7 Emulator” UA string in my list. This is simply a custom UA string I have added to test some sites on how they will render in the Windows Phone 7 browser.
To add your own UA strings go to Tools > Change user agent string > Custom.
Document mode
You can also change the document mode, which controls whether IE9 should use the most recent behaviour for HTML, CSS, DOM and JavaScript.
Let’s take an example of a site using the <video> tag. What happens if the user has IE8? Document mode makes it easy to test. (Test it yourself and go to www.dailymotion.com/html5.)
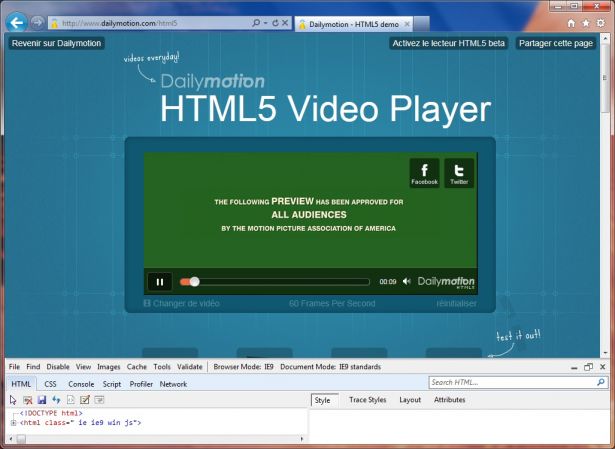
Here's a page showing video in standards mode, taking advantage of the <video> tag:
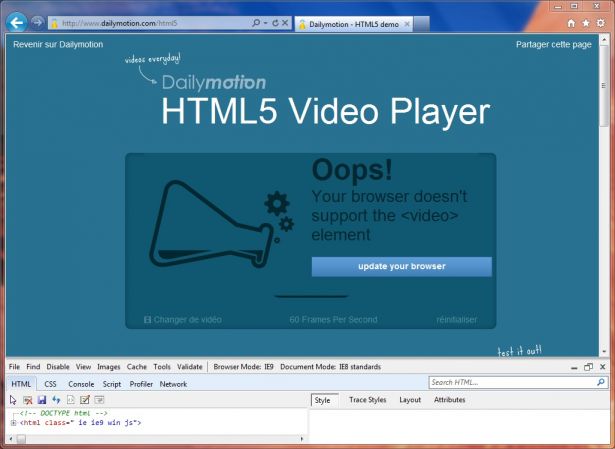
Choosing IE8 document mode makes the browser use IE8 behaviour. Since IE8 does not support the <video> tag, it renders the fallback text. Notice how the doctype directive has been commented out automatically in this rendering mode.
Note that document mode can also be enforced into IE7 or IE8 mode via a meta http-equiv attribute “X-UA-Compatible”.
You can learn more about the UXA compatibility tag here: msdn.microsoft.com/en-us/library/cc288325(v=vs.85).aspx.
Inspecting and editing HTML and CSS
The HTML tab offers you capabilities to inspect HTML in the document, search through the elements, see applied CSS rules, edit and save back the file locally.
Selecting an HTML element is done by using the Select icon (or Ctrl + B), or by using the search box.
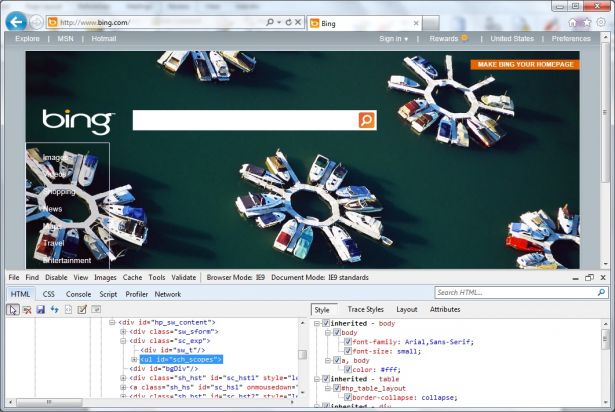
Notice I selected the <ul> that creates the list on the left. The element is selected in the DOM tree and its CSS Style rules applied to the current element are shown on the right. Here you can edit CSS rules directly, and check/uncheck the boxes to have rules enabled or disabled.
Trace styles shows an alphabetical list of CSS rules applied to the current object, taking into account CSS cascading. This is very useful in identifying why a certain rule is not being executed, for example due to a cascade of rules.

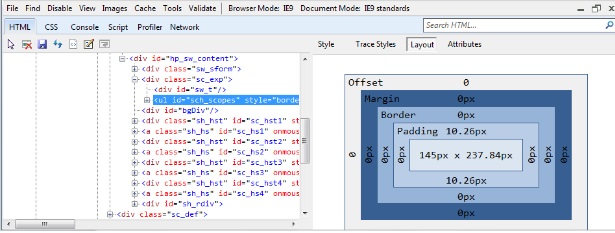
The Layout tool is extremely useful in viewing any settings related to padding, margins, offset for any element. Thanks to this, there are no more border pixels set in debug mode to help me with borders and margins!
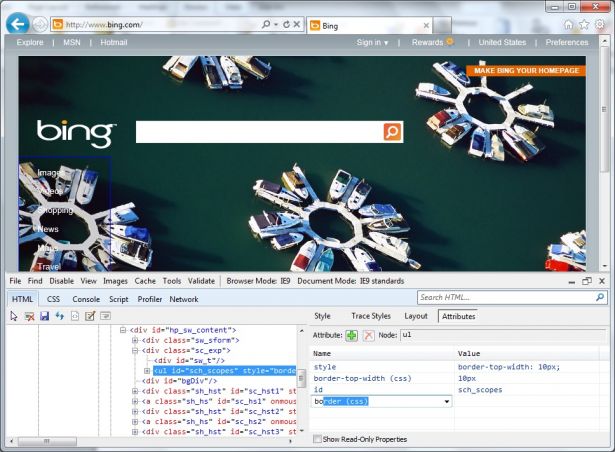
The Attributes tool is useful for directly adding or editing the attributes of the selected element.
Finally, the CSS tab allows you to view all the CSS rule of all inline and linked style sheets. Here you can also search, edit, enable/disable styles and save back to a local file.

JavaScript and Profiling
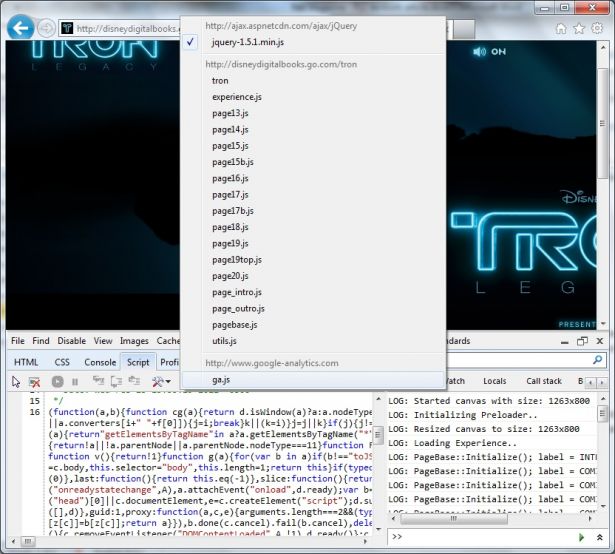
The JavaScript tab gives you access to all the scripts loaded by the current page. You get tools like the Console for direct script input, Watch, Locals, Call Stack and Breakpoint. Let’s take a look using disneydigitalbooks.go.com/tron/ as an example.
View the desired script by choosing from the dropdown:
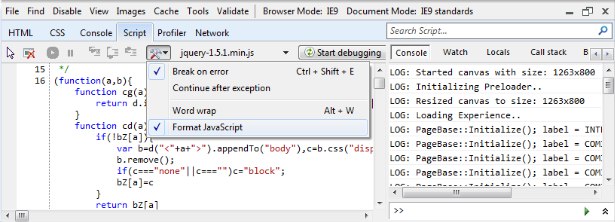
Tip: make minified script readable again by choosing Format JavaScript, a super helpful little tool.
You can add a breakpoint by right-clicking in the desired line of code. Run and debug by using the context toolbar that allows you to Run, Break, Step into, Step over and Step out of the code, just like you might be used in Visual Studio or other IDEs. Even the keyboard shortcuts are the same.
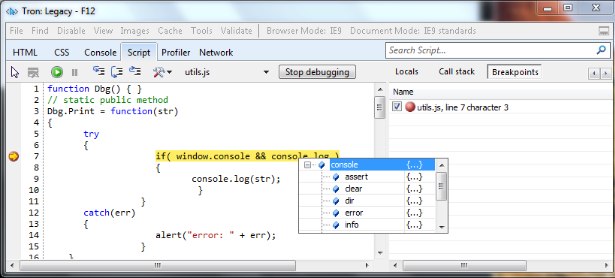
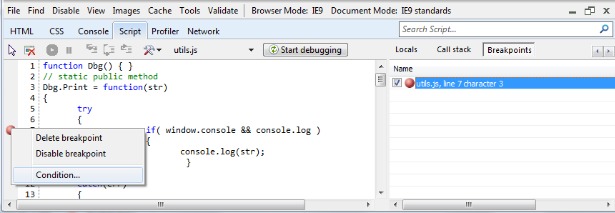
Tip: you can even add a breakpoint only to hit when a certain condition is true (conditional breakpoint). Right-click any breakpoint and choose Condition. Enter an expression; if evaluated to true, the breakpoint will hit.
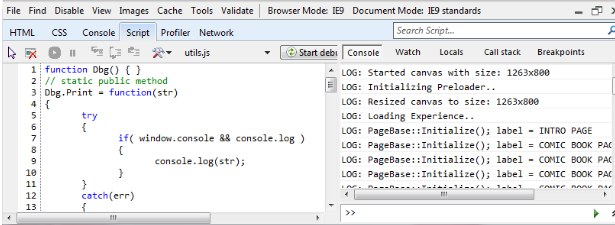
Logging in the console, no more alert()
Who’s never used alert()for debugging a piece of script? I will admit using it a few times when no one was watching. Today, the logging API comes to rescue to capture messages in your code. Notice how the Tron website writes several messages to the console:
So you say performance is your thing?
Another not-to-be missed feature in the script section is the Profiling tool, which helps us identify and fix performance issues quickly. Click Start Profiling to record the session. After recording, the profile report can be viewed by Functions or Call Tree. Personally I prefer the Call Tree, which provides a hierarchical view of the calls and lets me drilldown further.
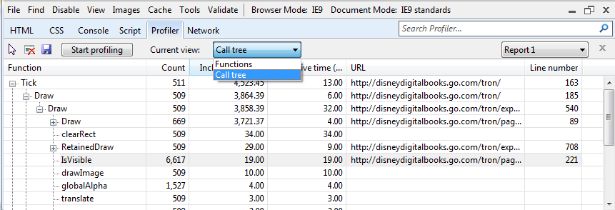
When you drilldown in the call tree, you can double-click loaded functions, which will jump you right into the correct code line on the original file. Pure goodness.
The Network tab
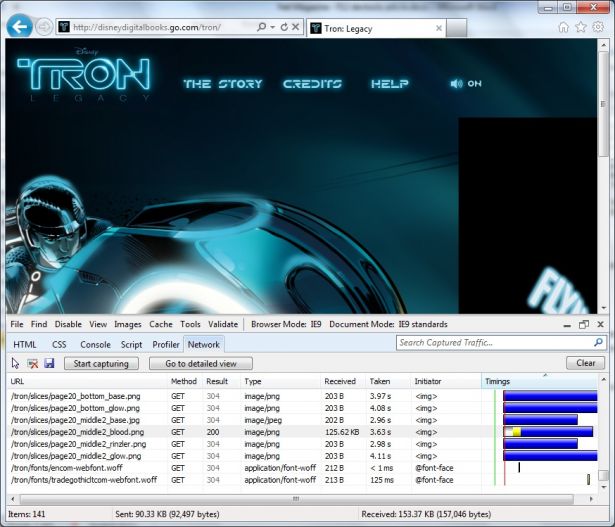
Last but not least, you can now inspect network traffic with the new Network tab. To capture network traffic for a specific page, including Ajax calls, press the Start Capturing button. By default, network capture is set to off to prevent extra resource consumption.
The Summary view gives you all requests made by the page including calls from JavaScript.
Double-click any of the requests to go into detailed view. Here you can analyse Request headers and body, Response headers and body (in this case, jQuery script), any Cookies for the request, Initiator and Timings.

Initiator deserves a special mention. It gives you more details as well as direct linking to the code line from which the request was initiated.

And that’s it for our glimpse at all the goodness in F12 devtools. Try out the tools yourself and discover more hidden features!
Resources:
You can learn more about the developer tools on MSDN: msdn.microsoft.com/en-us/library/dd565626(VS.85).aspx.

Thank you for reading 5 articles this month* Join now for unlimited access
Enjoy your first month for just £1 / $1 / €1
*Read 5 free articles per month without a subscription

Join now for unlimited access
Try first month for just £1 / $1 / €1
The Creative Bloq team is made up of a group of design fans, and has changed and evolved since Creative Bloq began back in 2012. The current website team consists of eight full-time members of staff: Editor Georgia Coggan, Deputy Editor Rosie Hilder, Ecommerce Editor Beren Neale, Senior News Editor Daniel Piper, Editor, Digital Art and 3D Ian Dean, Tech Reviews Editor Erlingur Einarsson, Ecommerce Writer Beth Nicholls and Staff Writer Natalie Fear, as well as a roster of freelancers from around the world. The ImagineFX magazine team also pitch in, ensuring that content from leading digital art publication ImagineFX is represented on Creative Bloq.
