Create an app that collects sensor data
Take your client-side web skills into the real world by creating a sensor-driven weather app.

Today, affordable platforms for developing interconnected products are enjoying widespread availability, and we've seen a push for increased JavaScript support in IoT technologies, with powerful companies like IBM, Google, Intel, Microsoft and Cisco opening up APIs for their products. The result is an expanded ecosystem of micro-controllers, data loggers connected to cloud services, and adaptable interfaces that parse data in real time, all of which present new opportunities for designers with client-side web skills.
With that in mind, the aim of this tutorial is to design and build something that's not just 'neat', but is useful in the real world: an interconnected product (or service) that uploads weather data from a sensor into a local web server, and displays this data in an adaptive user interface in real time. This project illustrates how we can break away from direct manipulation in UI design, and demonstrates some ways designers can take their prototyping techniques beyond web servers and flat designs.
Take a look at the source files for this tutorial.
Sensors and microcontrollers
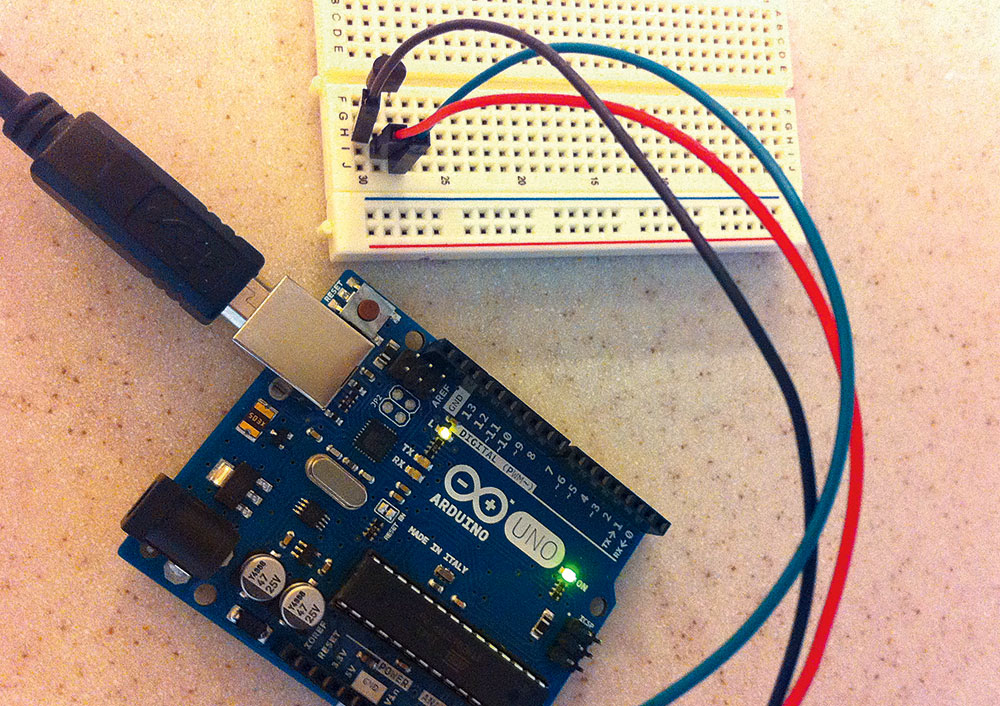
For this tutorial we'll use the Arduino microcontroller. This is a popular choice thanks to a cheap price, easy development kit and lots of online support. To set up your microcontroller on your computer, download the development environment (the IDE option) here. The microcontroller plugs into your computer with a USB cable that also powers it. Arduino code is known as sketches, which are written in C++-based code to parse data coming in from sensors.

As we're designing an app that reads weather data, I've used the LM35 temperature sensor. This is a good, affordable option, but just like with microcontrollers there are plenty to choose from. Set up the LM35 sensor, along with jumper wires and breadboard as per these instructions.
The microcontroller works with a sketch file that creates a data feed from the LM35 temperature sensor directly into your local file system. To set this up, first you need to declare a variable to hold analogue data from the sensor (a variable is a way of naming and storing a value for later use by the program – in this case data from a sensor).
Declare a setup() function that communicates with the serial port in your laptop. This is called when an Arduino sketch starts, and it will record to the serial window. The serial port is used for communication between the Arduino board and your laptop.
Get the Creative Bloq Newsletter
Daily design news, reviews, how-tos and more, as picked by the editors.
Next, we need to set the baud rate – the rate at which information is transferred. We want a rate of 9600, which means the serial port is capable of transferring a maximum of 9600 bits per second from the signal, originating in the LM35 temperature sensor, travelling through the USB cable into your laptop. Convert the captured raw sensor data first into temperature format, then from integer to text to be inserted into JSON and held in memory.
Finally, loop the above function so the sensor collects temperature data continuously. The Arduino microcontroller will run uninterrupted in the background, collecting temperature data in your laptop's serial port.

A web-based API
Once the temperature reading is recorded in memory, a timestamp needs to be added to it before inserting it into the JSON format. To begin, we need to establish the location where the JSON file will reside, and open that file at short intervals to append the readings.
It is possible to achieve this using advanced web server technology, but this is beyond the scope of this article and would take us away into different tangents. For the sake of simplicity we will use Processing to parse the sensor data, but there are a lot of up-and-coming, robust JS-based web server programming technologies that can be used to acquire the sensor data from the serial port memory into any web server or the cloud (see here).
Processing uses a sketch file to get data sent by Arduino by listening to data in the serial port and returning a string to hold the readings. It also makes use of a draw() function, which continuously executes the lines of code contained inside its block – in this case taking the values from the serial port, adding a timestamp and printing them in a text file ending in a JSON structure similar to ["18:05:53", 43.00] .
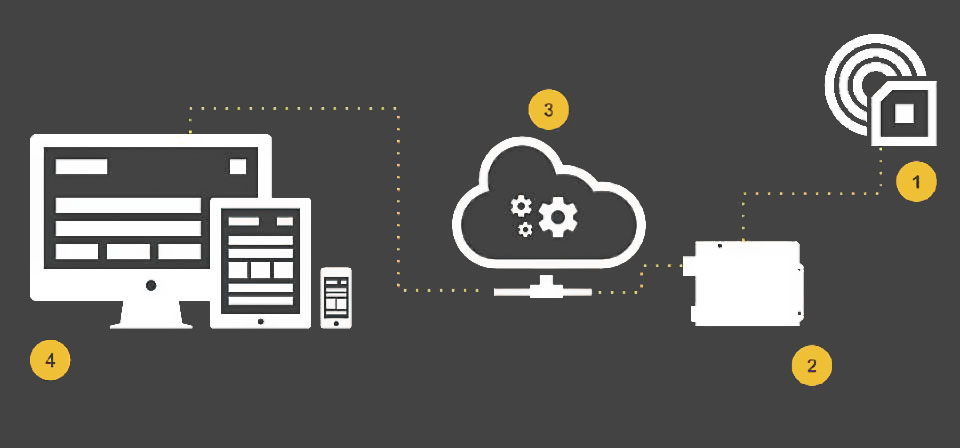
Eventually we end up with a system that includes just one temperature sensor, microcontroller and web server. This is a prototype for a larger data acquisition system composed of sensor networks and the cloud, representing a real world product or service.
An adaptive interface
At this point we want to put together a simple UI with a single-page application (SPA) starter pack and a JS-based tool like React or Angular. I've picked React because it makes it easy to describe what the browser should render, removes a lot of noise when building the DOM in the browser, and binds data from any API very fast. Also, instead of re-rendering the entire DOM, it only updates the UI elements that have changed, which is great for prototyping.
To get started with your UI, first install the SPA using one of the many starter packs available online. A very convenient one is the web app boilerplate React kit. Once you've familiarised yourself with the file structure, you'll need to set up a new component that accesses the JSON feed in the local web server or a cloud service and processes the data for display.
In React, setState is the main method used to trigger UI updates. Changes are triggered by event handlers or server request callbacks, and then need to be implemented correctly to read the JSON file. Finally, we define the variable readings to hold the parsed data, and the <ReadingsList /> tag in the render method to represent the UI component that serves the visualisation:
loadPathsData() {
  this.setState({data: data});
}

loadInitialState() {
  return {data: {readings: []}};
}

componentWillMount() {
  this.loadPathsData();
}

render() {
  return (
    <div>
      <ReadingsList data={this.state.data}/>
    </div>
  );
}
Define the ReadingsList UI component to hold the readings from the previously created JSON file. Add a new class (Readings List) directly above the class definition. React uses the render method to implement the virtual representation of a native DOM component (such as the <div /> below) or any other defined component. As a result we have a UI component that displays the JSON readings:
var ReadingsList = React.createClass ({
  render: function() {
    return (
      <div>

      </div>
    )
  }
});
Combine dynamic CSS declarations with data mappings to style the readings in the browser.
You can force-refresh at either the component or browser level at short intervals. This can be done using the more robust React forceUpdate function (which tells React it needs to re-run render() above by calling forceUpdate), or implemented in the Jade template rendering with a basic setInterval function.
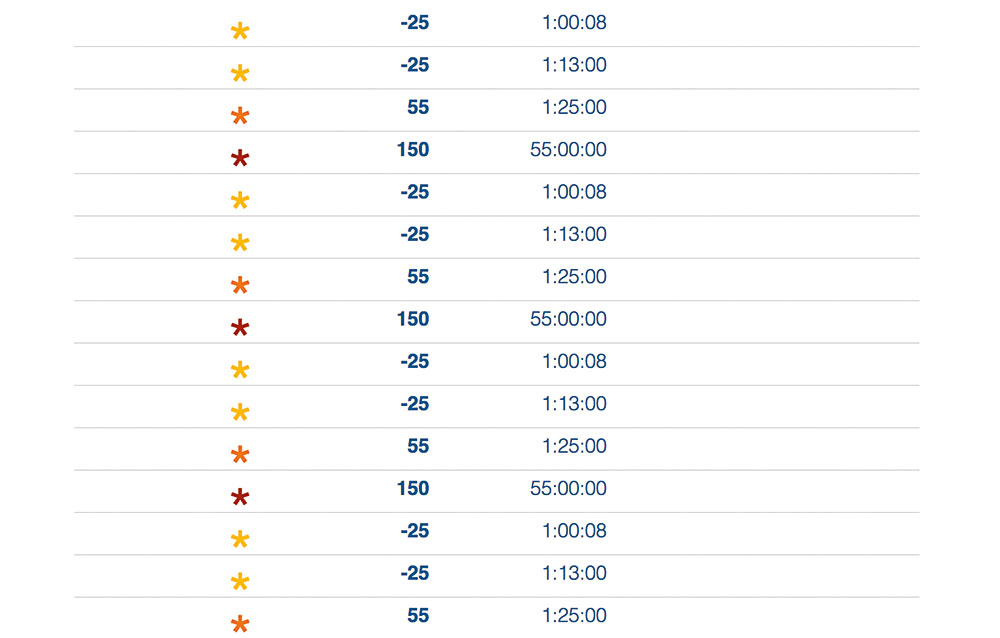
When relaunching the SPA, all components reload the temperature readings in real time as the JS and CSS are combined dynamically in a cross-device visualisation. The result is shown in the image below.

What's next?
The basic IoT prototyping concepts illustrated in this article can be built upon in order to design interconnected products or services that make dynamic data useful and usable in adaptive UIs, whether these are served in a mobile device, smaller display or even an interactive TV screen. Basic web development skills can be taken beyond web servers and flat screen interfaces through Open Web technologies we are already familiar with.
Web professionals are starting to explore practical ways of working with data arrays that originate in sensors and then have a user interface designed around them. These explorations offer new ways of thinking about data and design in interconnected products, in which CSS is not just about styles but a vehicle through which to create meaningful connections between humans and data. There is also a lot to experiment with in new and upcoming CSS-based technologies that couple CSS declarations with data elements to enhance digital experiences, including browser rendering techniques.
Data is all around us, and we have a unique opportunity to use it to see the unseen, and write hooks for it in CSS through JavaScript… we're talking about lessening friction and creating a seamless contact point between humans and any digital product. The adoption of JavaScript in IoT platforms suggests CSS will still be a primary styling tool of choice for JavaScript-based clients or web browsers of all sizes for a while.
This article originally appeared in net magazine issue 289; buy it here!
Related articles:

Thank you for reading 5 articles this month* Join now for unlimited access
Enjoy your first month for just £1 / $1 / €1
*Read 5 free articles per month without a subscription

Join now for unlimited access
Try first month for just £1 / $1 / €1

