How to create a dashboard app with React
11. Show a progress bar
Inside NumberWidget.js there are a couple of methods that help us to render things under certain conditions. We can call these in the render method and they can return what we need to output.
Inside showProgress() add some code that works out if we should render a progress bar. We need a minimum, maximum and a value at the very least.
if (this.props.min !== undefined &&
  this.props.max !== undefined &&
  this.props.value !== undefined) {
   return <Progress min={this.props.min}
     max={this.props.max}
     value={this.props.value} />;
  }
return null;
12. Add a Container component
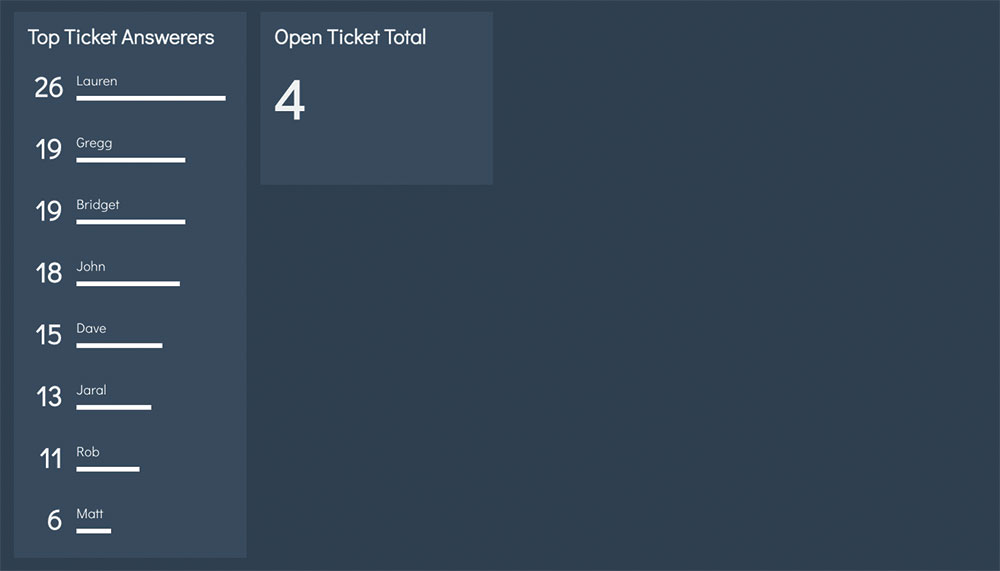
Manually adding data isn't going to be much help to us. We can add a container around NumberWidget that will supply it with fresh data from our server. Inside App.js, replace what we added in step 10 with the NumberWidgetContainer and pass it a URL to load data from.
import NumberWidgetContainer from
  ../components/NumberWidgetContainer';
[…]
<NumberWidgetContainer href="
  http://localhost:3001/tickets/open"
  heading="Open Ticket Total" />
13. Fetch data on load
Over its lifetime, a React component will call many different methods depending on what point it's at. The componentDidMount method will be called when a component first renders, which makes it an ideal place to fetch data.
Add the following to componentDidMount in NumberWidgetContainer.js. This will call the fetchData method now and every minute after that. We will fix the TypeError in the next step.
this.getData().then(_ => {
  this.interval =
    setInterval(this.getData, 60000);
});
14. Update the state
Each component can have its own internal state, which holds information about itself at any given moment. We can pass this state as props for other components to use.
Make the request to the supplied href prop URL using the AJAX module Axios and update the state with the values supplied. These will automatically be passed to NumberWidget, which will then update itself.
Daily design news, reviews, how-tos and more, as picked by the editors.
this.setState({ loading: true });
return axios.get(this.props.href)
.then(resp => {
  this.setState({
  loading: false,
  min: resp.data.min,
  max: resp.data.max,
  value: resp.data.value
  });
})
15. Add in a List widget
The groundwork we have done for NumberWidget can be applied to other types of widgets, too. ListWidgetContainer can be passed the same props as NumberWidgetContainer, but will render a list of values instead.
Import ListWidgetContainer alongside the rest, and place the component just above NumberWidgetContainer in the render method.
import NumberWidgetContainer from
  '../components/NumberWidgetContainer';
[…]
<ListWidgetContainer
  href="http://localhost:3001/stats/top"
  heading="Top Ticket Answerers"
rowspan={3} />
16. Display list items
With the data supplied in the sortedItems variable as an array, we can iterate over the results and render a separate component for each.
To do this we can use the 'map' method on the array prototype. This creates a new array of components that React will render. Inside the ListDisplay component in showWidget, add the map function to create new ListItems.
{sortedItems.map((item, index) =>
  <ListItem key={item.label}
   label={item.label} value={item.value}
min={min} max={max} />)}
17. Sort data by value

We should avoid relying on data being sorted at the source to ensure we provide useful information to the user. We can use a sorting function to do this inside the sortListItems method.
Array sorting functions take two values and compare them. Apply this to sortedItems and return it to sort its content in descending order.
return sortedItems.sort((a, b) => {
  if (a.value > b.value) {
  return -1;
  } else if (a.value < b.value) {
  return 1;
  }
  return 0;
});
18. Add a Graph widget
Graph widgets can display large sets of data clearer than the number or list widgets. It uses a library called Chart.js with a React wrapper that updates as props change.
Switch back to App.js, import GraphWidgetContainer and add it to the render function under the existing widgets.
import GraphWidgetContainer from
  '../components/GraphWidgetContainer';
[…]
<GraphWidgetContainer
href="http://localhost:3001
  /tickets/progression"
heading="Tickets Over Time"
colspan={2} rowspan={2} />
19. Prepare data for display
Chart.js takes data in a specific format. In this case, the 'datasets' array is a collection of points used to draw a line. We will use state to hold all the configuration data for Chart.js and update it with the datasets fetched from the URL, which arrive in a different format.
Open up GraphWidget.js and loop over the props in generateDatasets to update the state.
props.data.forEach(function (data) {
  datasets.push({
  label: data.label,
  data: data.data,
  fill: false,
  borderColor: data.color,
  pointRadius: 0,
  pointHitRadius: 10
  });
}, this);
20. Regenerate when props change
The React wrapper for Chart.js will update when its props change, but as the state holds the set up, we do not update those values directly.
componentWillReceiveProps is another lifecycle method that will fire when a component's props will update. Sometimes this can fire when values have not changed, but a quick check for that can protect against unnecessary updates.
if (this.props.data !== nextProps.data){
  this.generateDatasets(nextProps);
}
21. Add remaining widgets
Finally, all that is left to do is add in some more data. With the flexibility we have created from the various widgets, we can add in whichever widgets are necessary.
Fill in the remaining gaps on the page. Play around with the types, row and column spans, and positions of widgets to suit the data best.
<NumberWidgetContainer href="
  http://localhost:3001/tickets/today"
  heading="Tickets Opened Today" />
<NumberWidgetContainer href="
  http://localhost:3001/tickets/urgent"
  heading="Tickets Marked 'Urgent'" />
<NumberWidgetContainer href="
  http://localhost:3001/stats/response"
  heading="4 Hour Response %"
colspan={2}/>
This article originally appeared in Web Designer magazine. Subscribe here.

To improve your web design skills further, head to our conference Generate and experience a packed schedule of industry-leading speakers, workshops and valuable networking opportunities. Don't miss it! Get your Generate ticket now.
Related articles:
- 1
- 2
Current page: Make a dashboard app in React – steps 11-21
Prev Page Make a dashboard app in React – steps 1-10
Matt Crouch is a front end developer who uses his knowledge of React, GraphQL and Styled Components to build online platforms for award-winning startups across the UK. He has written a range of articles and tutorials for net and Web Designer magazines covering the latest and greatest web development tools and technologies.
