Boost your PageSpeed Insights score to improve the speed of your website
Find out how PageSpeed Insights gives you a to-do list for UX improvements.
Tools like PageSpeed Insights (PSI) and Lighthouse can be valuable for monitoring the performance of your sites. But why do you need them? When you're building a modern web experience, it's important to measure, optimise and monitor if you're to get fast and stay fast. Performance plays a significant role in the success of any site, as high-performing sites engage and retain users better than poorly-performing ones.
In this article, Addy Osmani, who manages the Web Developer Insights team in Chrome, is going to talk about the best thing since sliced bread: performance measurement and how these tools can help you to improve your website.
Need some new kit? Check out our pick of web design tools and top laptops for programming. Or, to make a whole new site, find the best website builder for your needs.
What do these tools do?
Lighthouse offers a comprehensive set of performance opportunities and the time saved by implementing each optimisation. You can find it in the Chrome DevTools Audits panel and in PageSpeed Insights.
PageSpeed Insights reports on the performance of a page on mobile and desktop devices and provides suggestions on how that page may be improved.
PSI provides both 'lab' (Lighthouse) and 'field' data about a page. Lab data
is useful for debugging performance issues, as it is collected in a controlled environment. However, it may not capture real-world bottlenecks. Field data is useful for capturing true, real-world user experience but has a more limited set of metrics.
Performance score
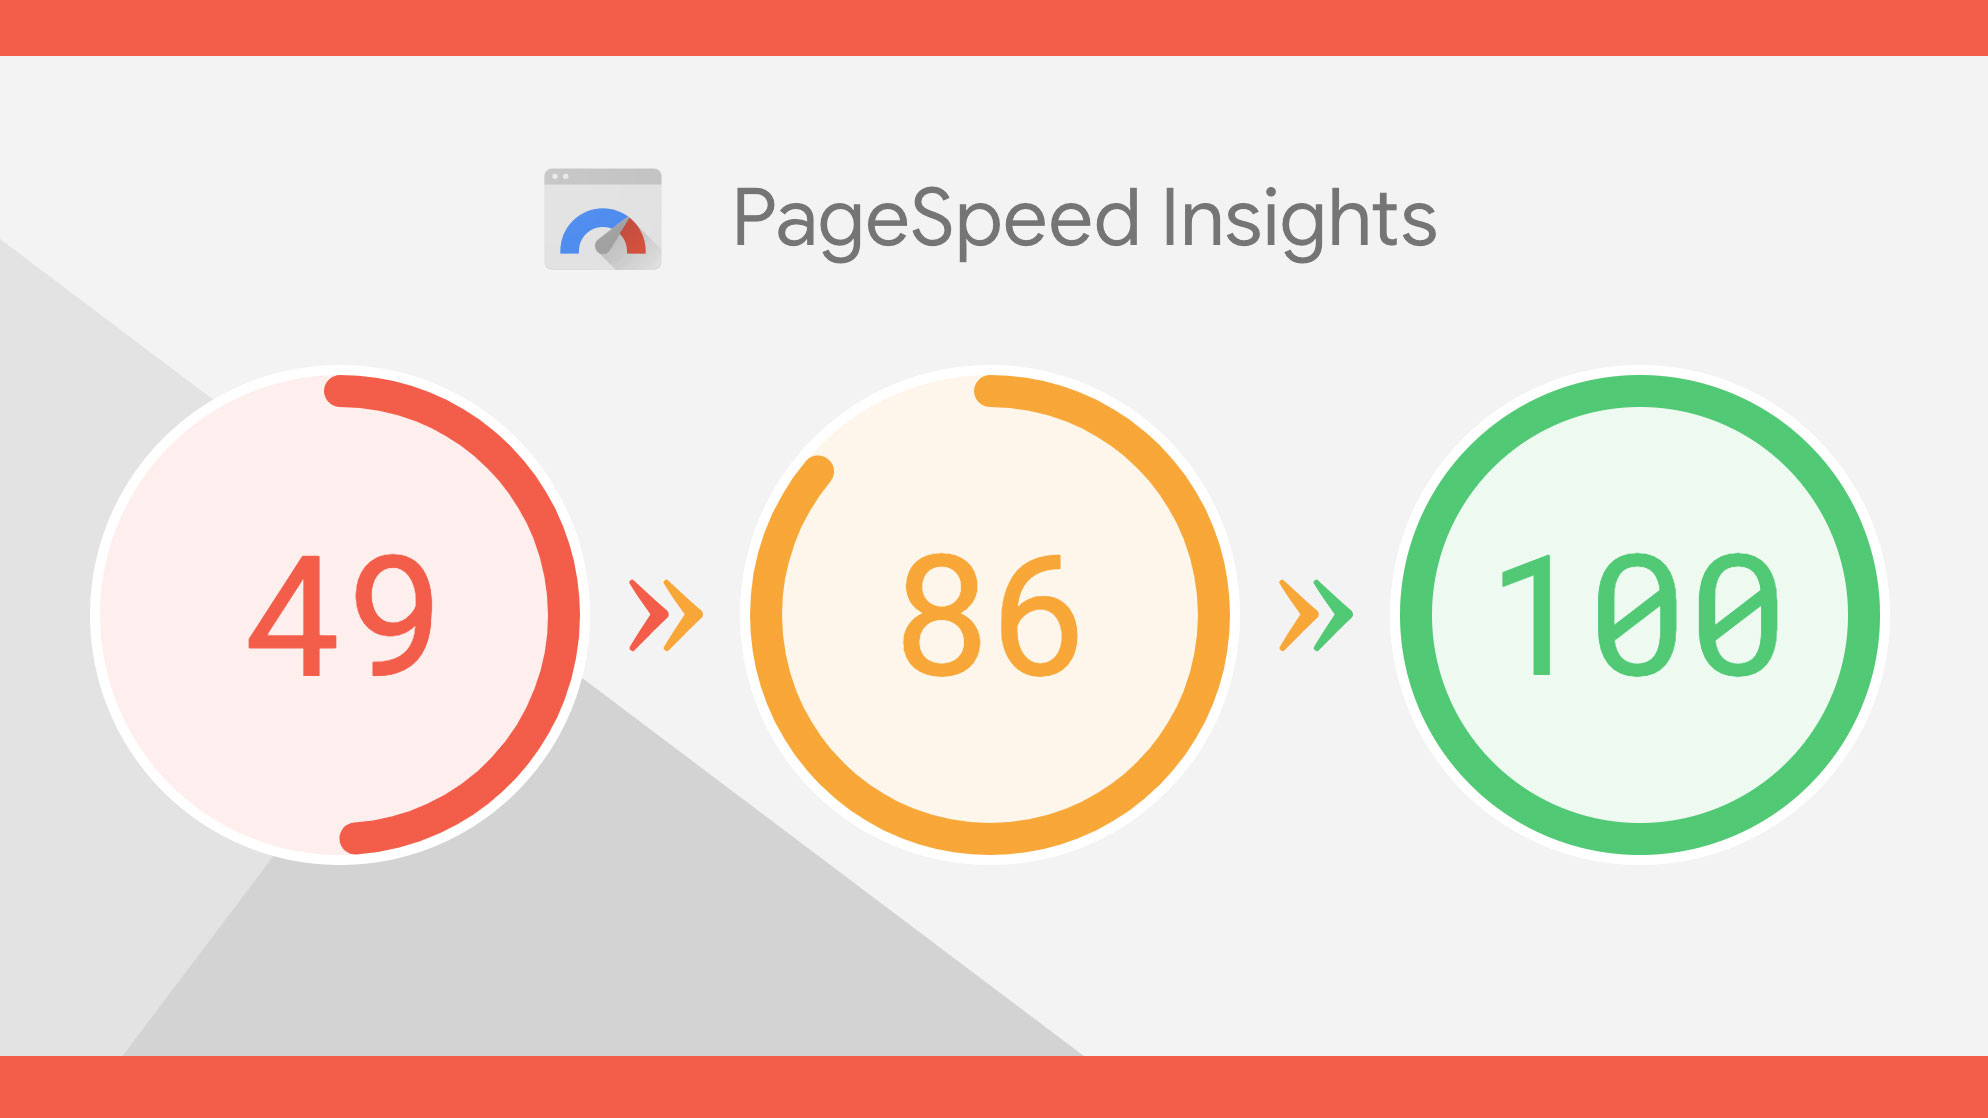
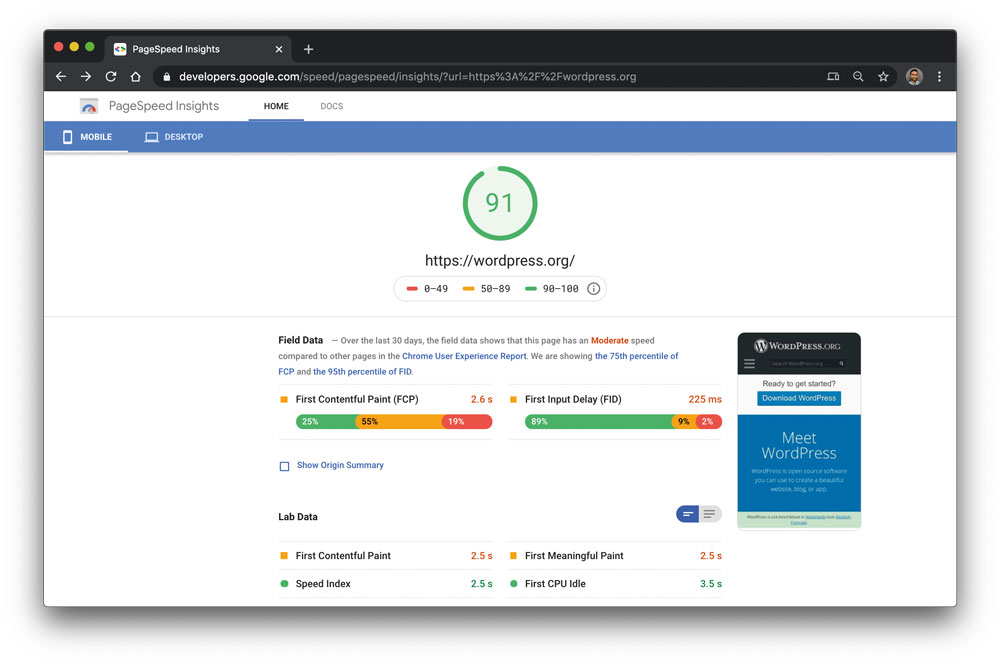
At the top of the report, PSI provides a score that summarises the page's performance. This score is determined by running Lighthouse to collect and analyse lab data about the page. A score of 90 or above is considered fast and 50 to 90 is considered moderate. Below 50 is considered to be slow.
Get the Creative Bloq Newsletter
Daily design news, reviews, how-tos and more, as picked by the editors.
Lab versus field data
Lab data
Lab data is performance data collected within a controlled environment with predefined device and network settings.
This offers reproducible results and debugging capabilities to help identify, isolate and fix performance issues.
Strengths:
- Helpful when it comes to debugging any performance issues
- End-to-end and offers deep visibility into the UX
- Provides reproducible testing and debugging environment
Limitations:
- Might not capture real-world bottlenecks
- Cannot correlate against real-world page KPIs
Note: Tools like Lighthouse and WebPageTest collect this type of data.
Field data
Field data (also called real user monitoring, or RUM) is performance data collected from real page loads your users are experiencing in the wild.
Strengths:
- Captures true real-world user experience
- Enables correlation to business key performance indicators
Limitations:
- Restricted set of metrics
- Limited debugging capabilities
Note: Public data sets like Chrome User Experience Report and performance tools like the PageSpeed Insights speed score report this type of data.
Performance metrics
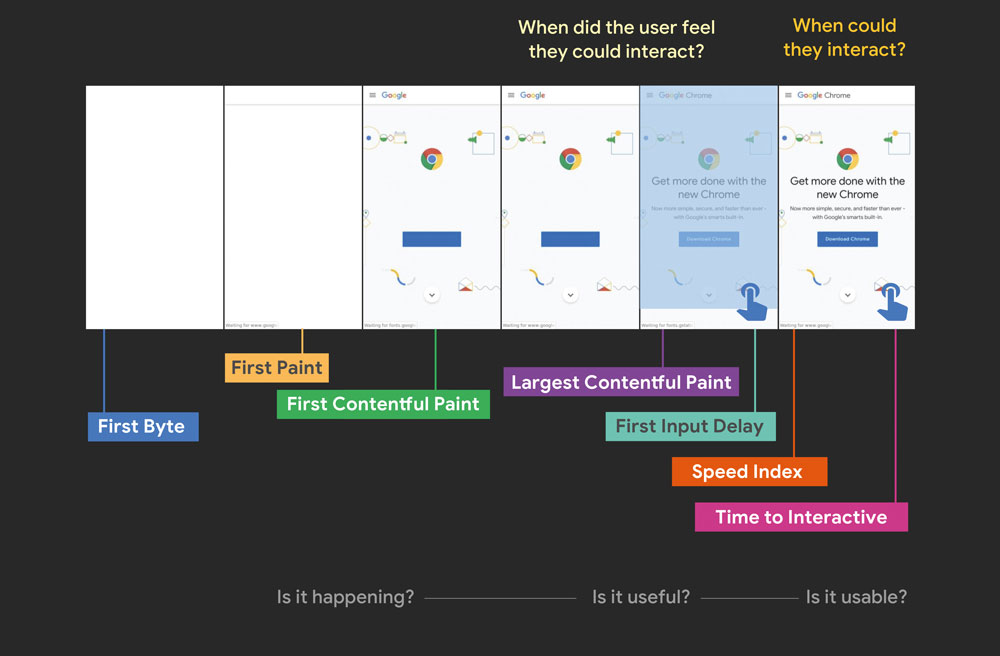
In the past, web performance has been measured with the load event. However, this moment doesn't necessarily correspond with what the user cares about. Over the last few years, browser teams have been working to standardise a set of new metrics and APIs that more accurately capture the performance of a web page.
To help ensure that the metrics are relevant to users, we frame them around a few key questions:
- Is it happening? Did the navigation start successfully? Has the server responded?
- Is it useful? Has enough content rendered that users can engage with it?
- Is it usable? Can users interact with the page or is it busy?
- Is it delightful? Are the interactions smooth and natural, free of lag?
There are a number of important metrics to measure and Lighthouse and PageSpeed Insights try to capture a few key ones.
- First Contentful Paint marks the time at which the first text or image is painted.
- Time to Interactive is the amount of time it takes for the page to become fully interactive (eg the user can click and see a response)
- Speed Index shows how quickly the contents of a page are visibly populated.
And there are some exciting new metrics that will be coming to our tools this year:
- Largest Contentful Paint (LCP): measures the time from when the page starts loading to when the largest text block or image element is rendered on the screen.
- Total Blocking Time (TBT): measures the total amount of time between FCP and TTI where the main thread was blocked for long enough to prevent input responsiveness
Learn more about modern performance metrics.
Real-world field data
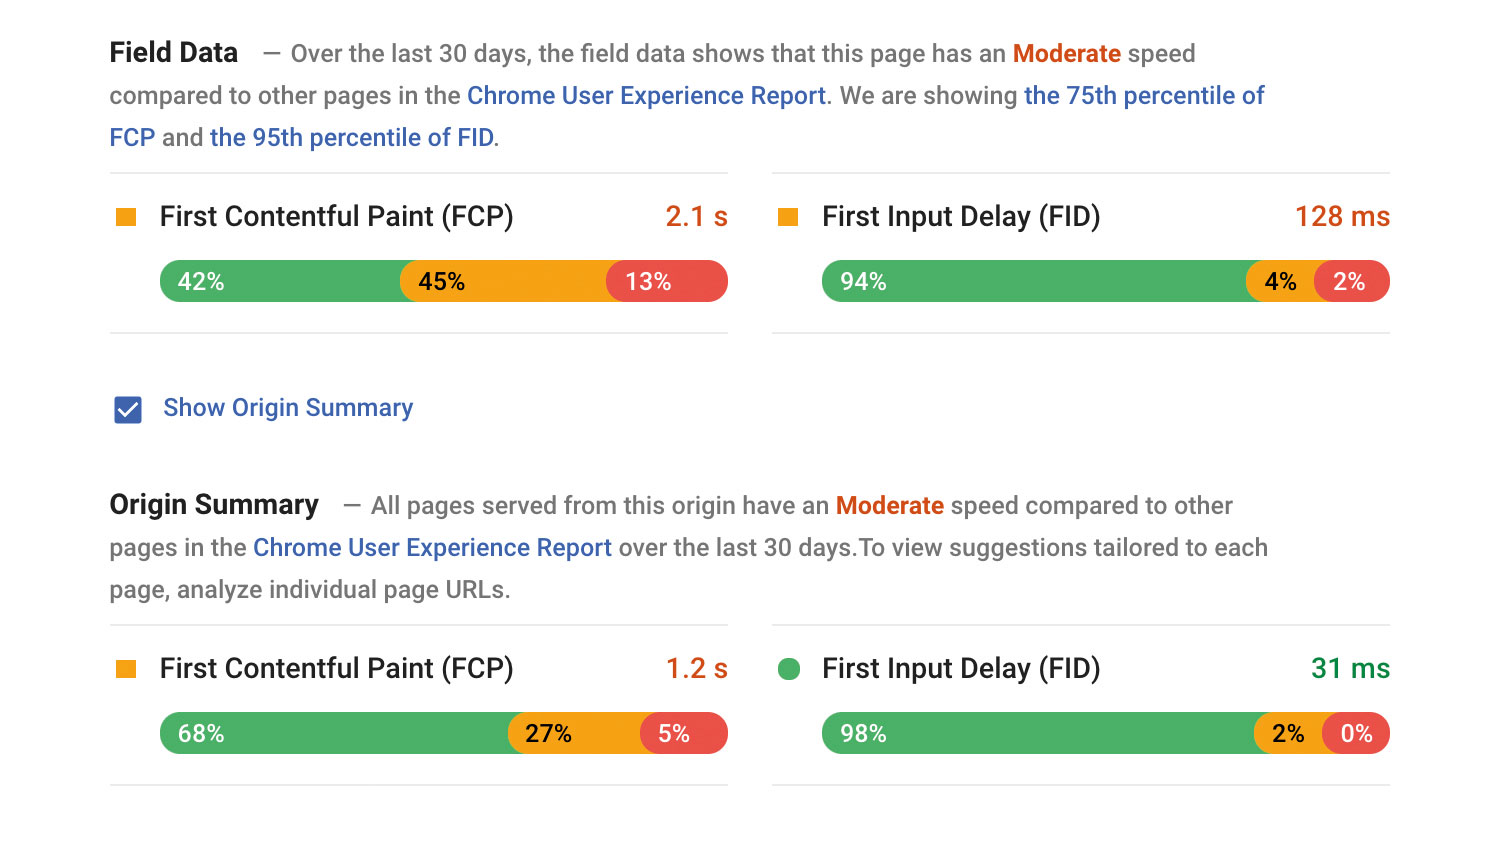
When PSI is given a URL, it will look it up in the Chrome User Experience Report (CrUX) dataset. If available, PSI reports the First Contentful Paint (FCP) and the First Input Delay (FID) metric data for the origin and potentially the specific page URL.
Classifying fast, moderate and slow
PSI also classifies field data into three buckets, describing experiences deemed fast, moderate or slow. PSI sets the following thresholds for fast/moderate/slow, based on the CrUX dataset:
FCP:
- Fast: 0 - 1,000ms
- Medium: 1,000ms - 3,000ms Slow: over 3,000ms
FID:
- Fast: 0 - 100ms
- Medium: 100ms - 300ms
- Slow: over 300ms
Lab data

PSI uses Lighthouse to analyse the given URL, generating a performance score that estimates the page's performance on different metrics, including: First Contentful Paint, Speed Index, Time to Interactive and estimated input latency (and to further improve your site, check you've got the ideal web hosting service for you).
Each metric is labelled with an icon:
- A fast metric is indicated with a green check mark
- Moderate is indicated with orange informational circle
- Slow is indicated with a red warning triangle
Audits
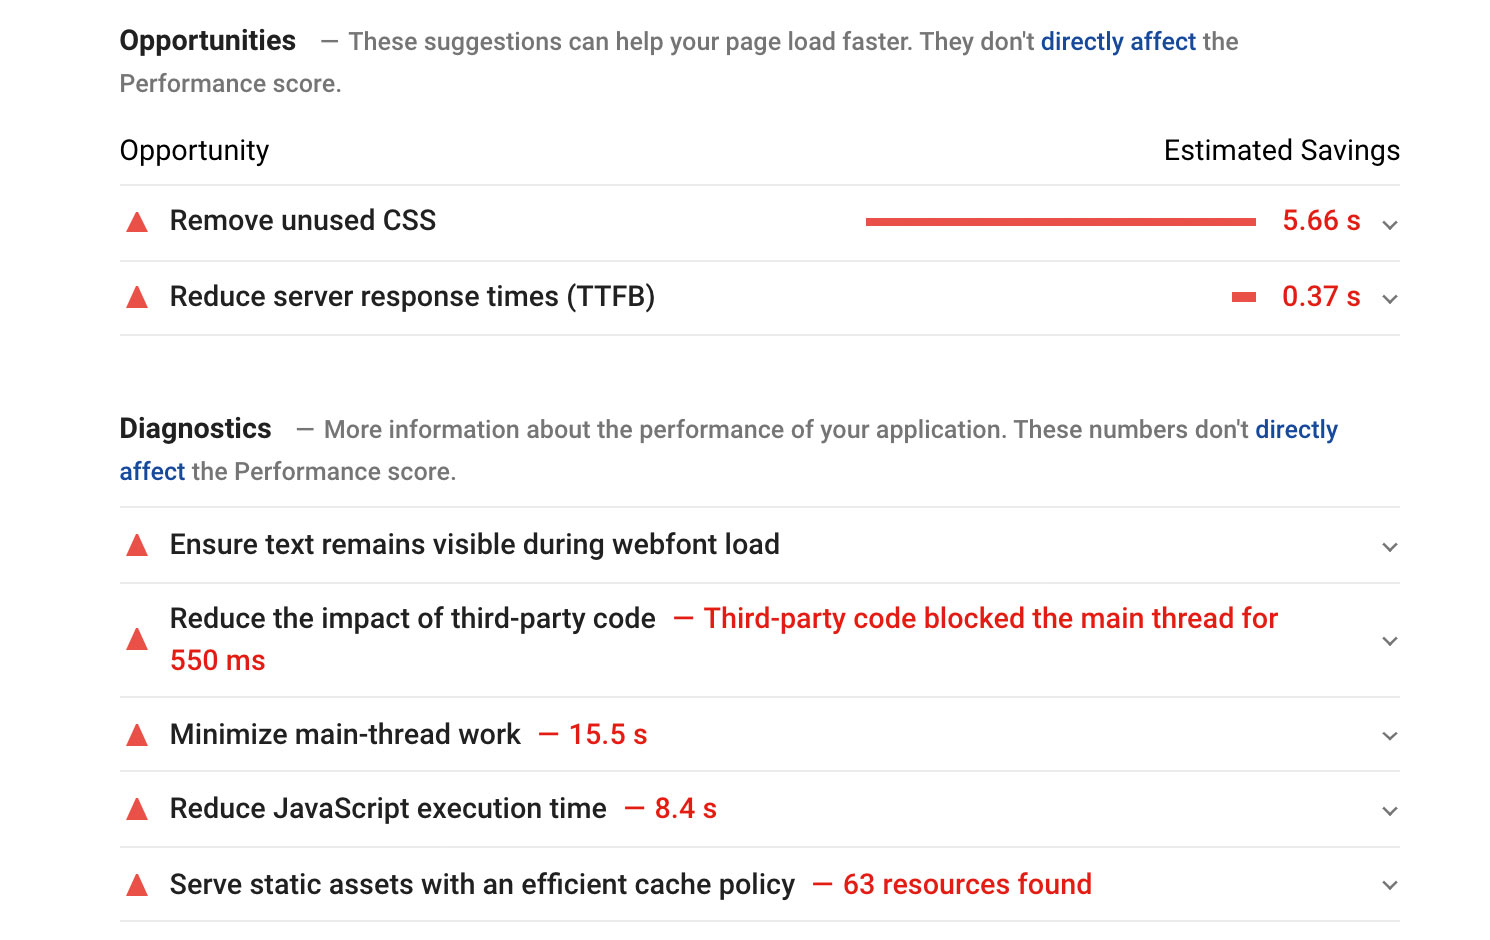
Lighthouse separates its audits into three different sections:
- Opportunities provides suggestions for how to improve the page's performance metrics. Each suggestion in this section estimates how much faster the page will load if the improvement is implemented
- Diagnostics provides additional information about how a page adheres to best practices for web development
- Passed Audits indicates the audits that have been passed by the page
Optimising performance
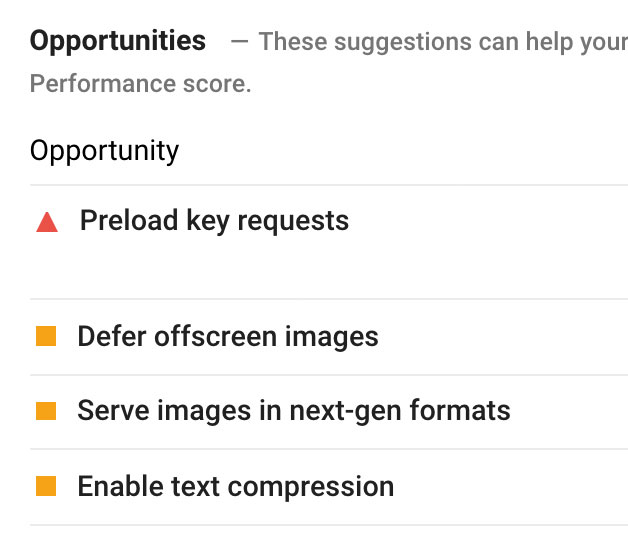
There are several optimisations you can apply to improve your Lighthouse/ PageSpeed Insights metrics.
To improve First Contentful Paint:
- Minify CSS and remove unused CSS
- Eliminate any render-blocking resources
- Preconnect to required origins
- Reduce server response times
- Avoid multiple page redirects
- Avoid an excessive DOM size
- Ensure text remains visible during the loading of web fonts (eg with font-display)
Sending large JavaScript payloads significantly impacts the speed of your site, in particular how soon users can interact with your pages. To improve time to interactive for a site, you could:
- Minify and compress JavaScript
- Deliver only the JavaScript users need when they need it (eg with code- splitting) Reduce the impact of third-party code (eg lazy-loading these resources)
- Reduce JavaScript execution time by optimising costly long tasks
- Preload key scripts, especially if your site is a single-page application
Many of these optimisations can also improve your Speed Index. Get more performance tips for Lighthouse/PageSpeed scores here.
PageSpeed Insights API
Related to PSI is the PageSpeed Insights API, which provides free access to performance monitoring for web pages and returns data with suggestions for how to improve. The V5 API includes lab data from Lighthouse and real-world data from the Chrome User Experience Report (CrUX).
```js
const url = ‘https://wordpress.org’;
const apiCall = `https://www.googleapis.com/pagespeedonline/v5/runPagespeed?url=${url}`;
const response = await fetch(apiCall);
const json = await response.json();
Teams use the API to build dashboards, custom reports and custom integrations with other user-experience measurement tools. The responses from the API could be used to monitor and graph any of the data from the PSI tool we covered earlier.
It's possible to build highly-customised reports using PSI data. For example, Vrbo, a vacation rentals site, graphs real-world data from the PSI API to track long-term performance trends to ensure its speed remains competitive within the travel industry.
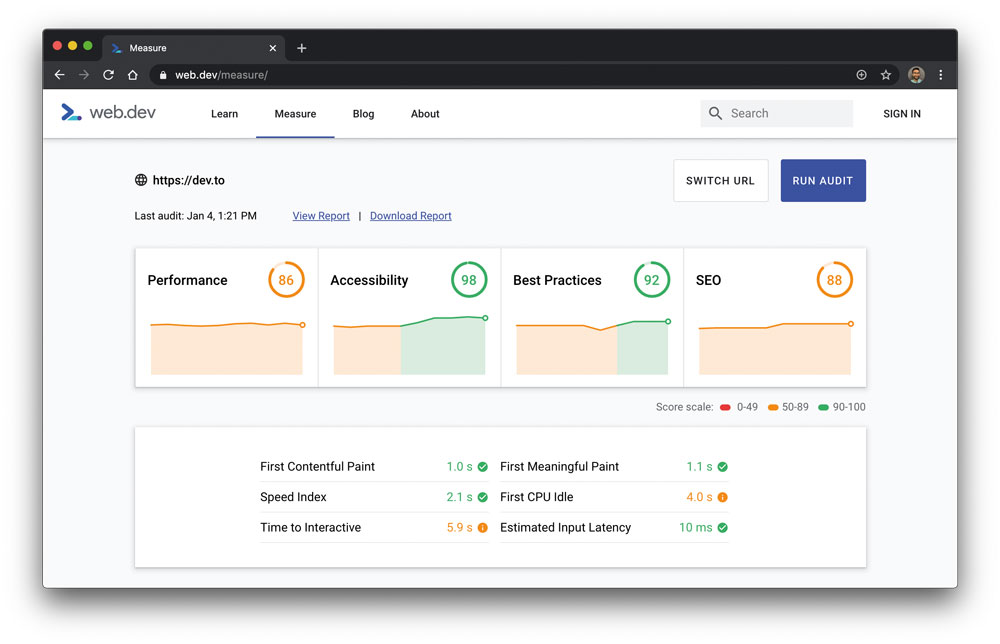
Web.dev Measure uses the same back end as PSI and uses this data for historical measurement over time.
It's helpful to become familiar with the structure of the PSI API response. There's metrics info available for lab and field/real-world:
```js
const url = ‘https://wordpress.org’;
const apiCall = `https://www.googleapis.com/pagespeedonline/v5/runPagespeed?url=${url}`;
fetch(apiCall)
  .then(response => response.json())
  .then(json => {
      // Real-world metrics
      const cruxMetrics = {
      “First Contentful Paint”: json.loadingExperience.metrics.FIRST_CONTENTFUL_PAINT_MS.category,
      “First Input Delay”: json.loadingExperience.metrics.FIRST_INPUT_DELAY_MS.category
      };
      // Lab metrics
      const lighthouse = json.lighthouseResult;
      const lighthouseMetrics = {
      ‘First Contentful Paint’: lighthouse.audits[‘first-contentful-paint’].displayValue,
      ‘Speed Index’: lighthouse.audits[‘speed-index’].displayValue,
      ‘Time To Interactive’: lighthouse.audits[‘interactive’].displayValue,
      };
      // ...
});
Responses from the PSI API are focused on performance data. That said, you can supply the ?category argument to specify any additional Lighthouse audit categories you would like data for.
```sh
curl -i “https://www.googleapis.com/pagespeedonline/v5/runPagespeed?url=https://web.dev&category=pwa&category=performance&category=accessibility&category=best-practices&category=seo”
You can also supply a locale or strategy argument (desktop or mobile – which simulates a page load on a median-class device – for example a Moto G4 – on a mobile network).
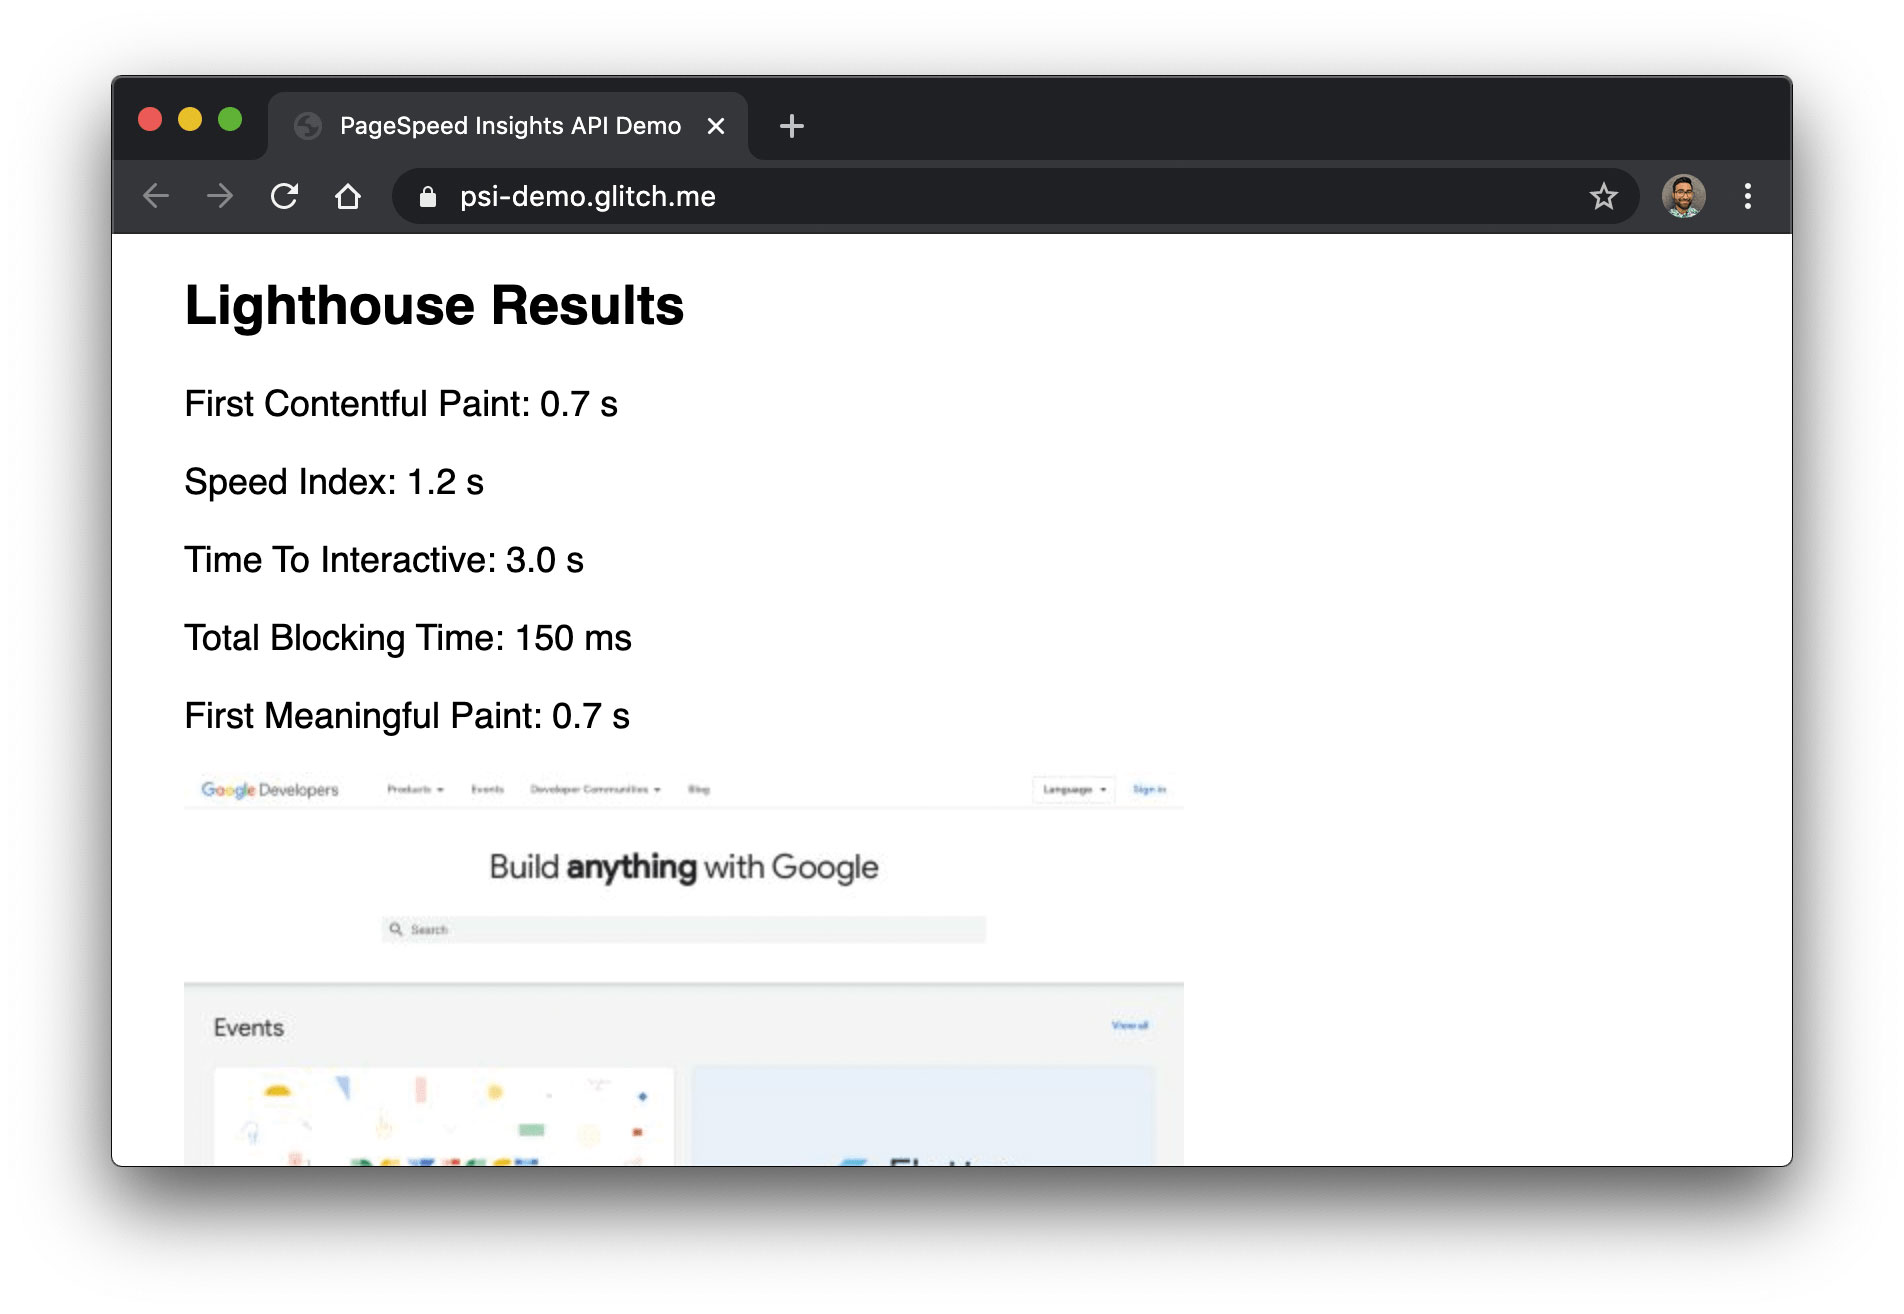
Lighthouse is starting to support Stack Packs, stack-specific recommendations that provide more detailed guidance on how to implement optimisations (eg WordPress). PSI's API responses also support this so if you're testing a WordPress site, these strings are included (eg a demo URL for wordpress.org would be https:// www.googleapis.com/pagespeedonline/v5/ runPagespeed?rl=https://wordpress.org).
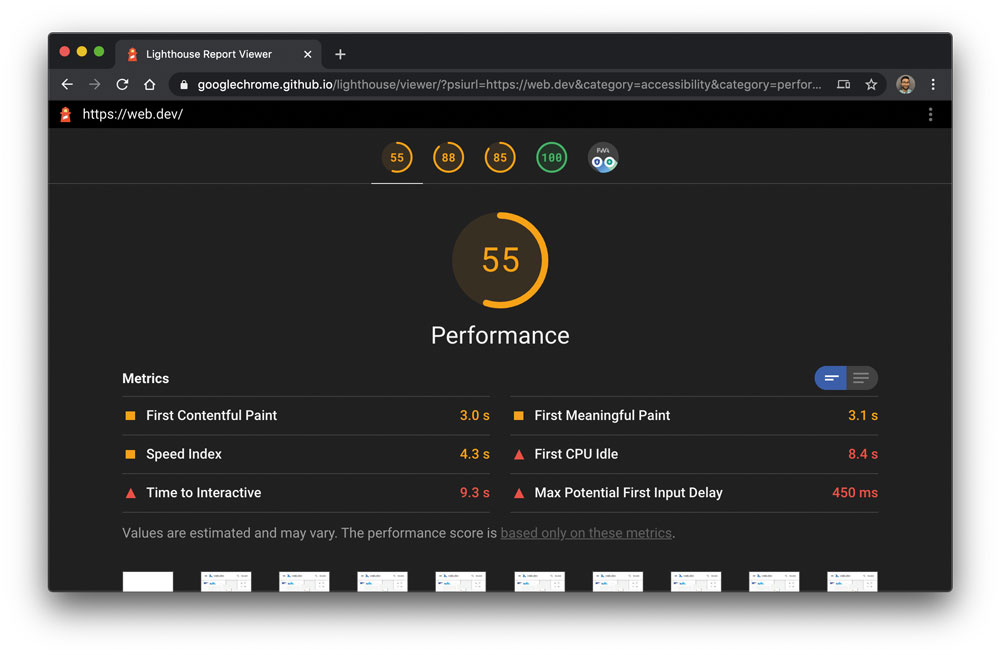
The PSI tool also supports fetching PSI API data and rendering it with the official Lighthouse Viewer. Pass ?psiurl as a parameter in order to see this in action.
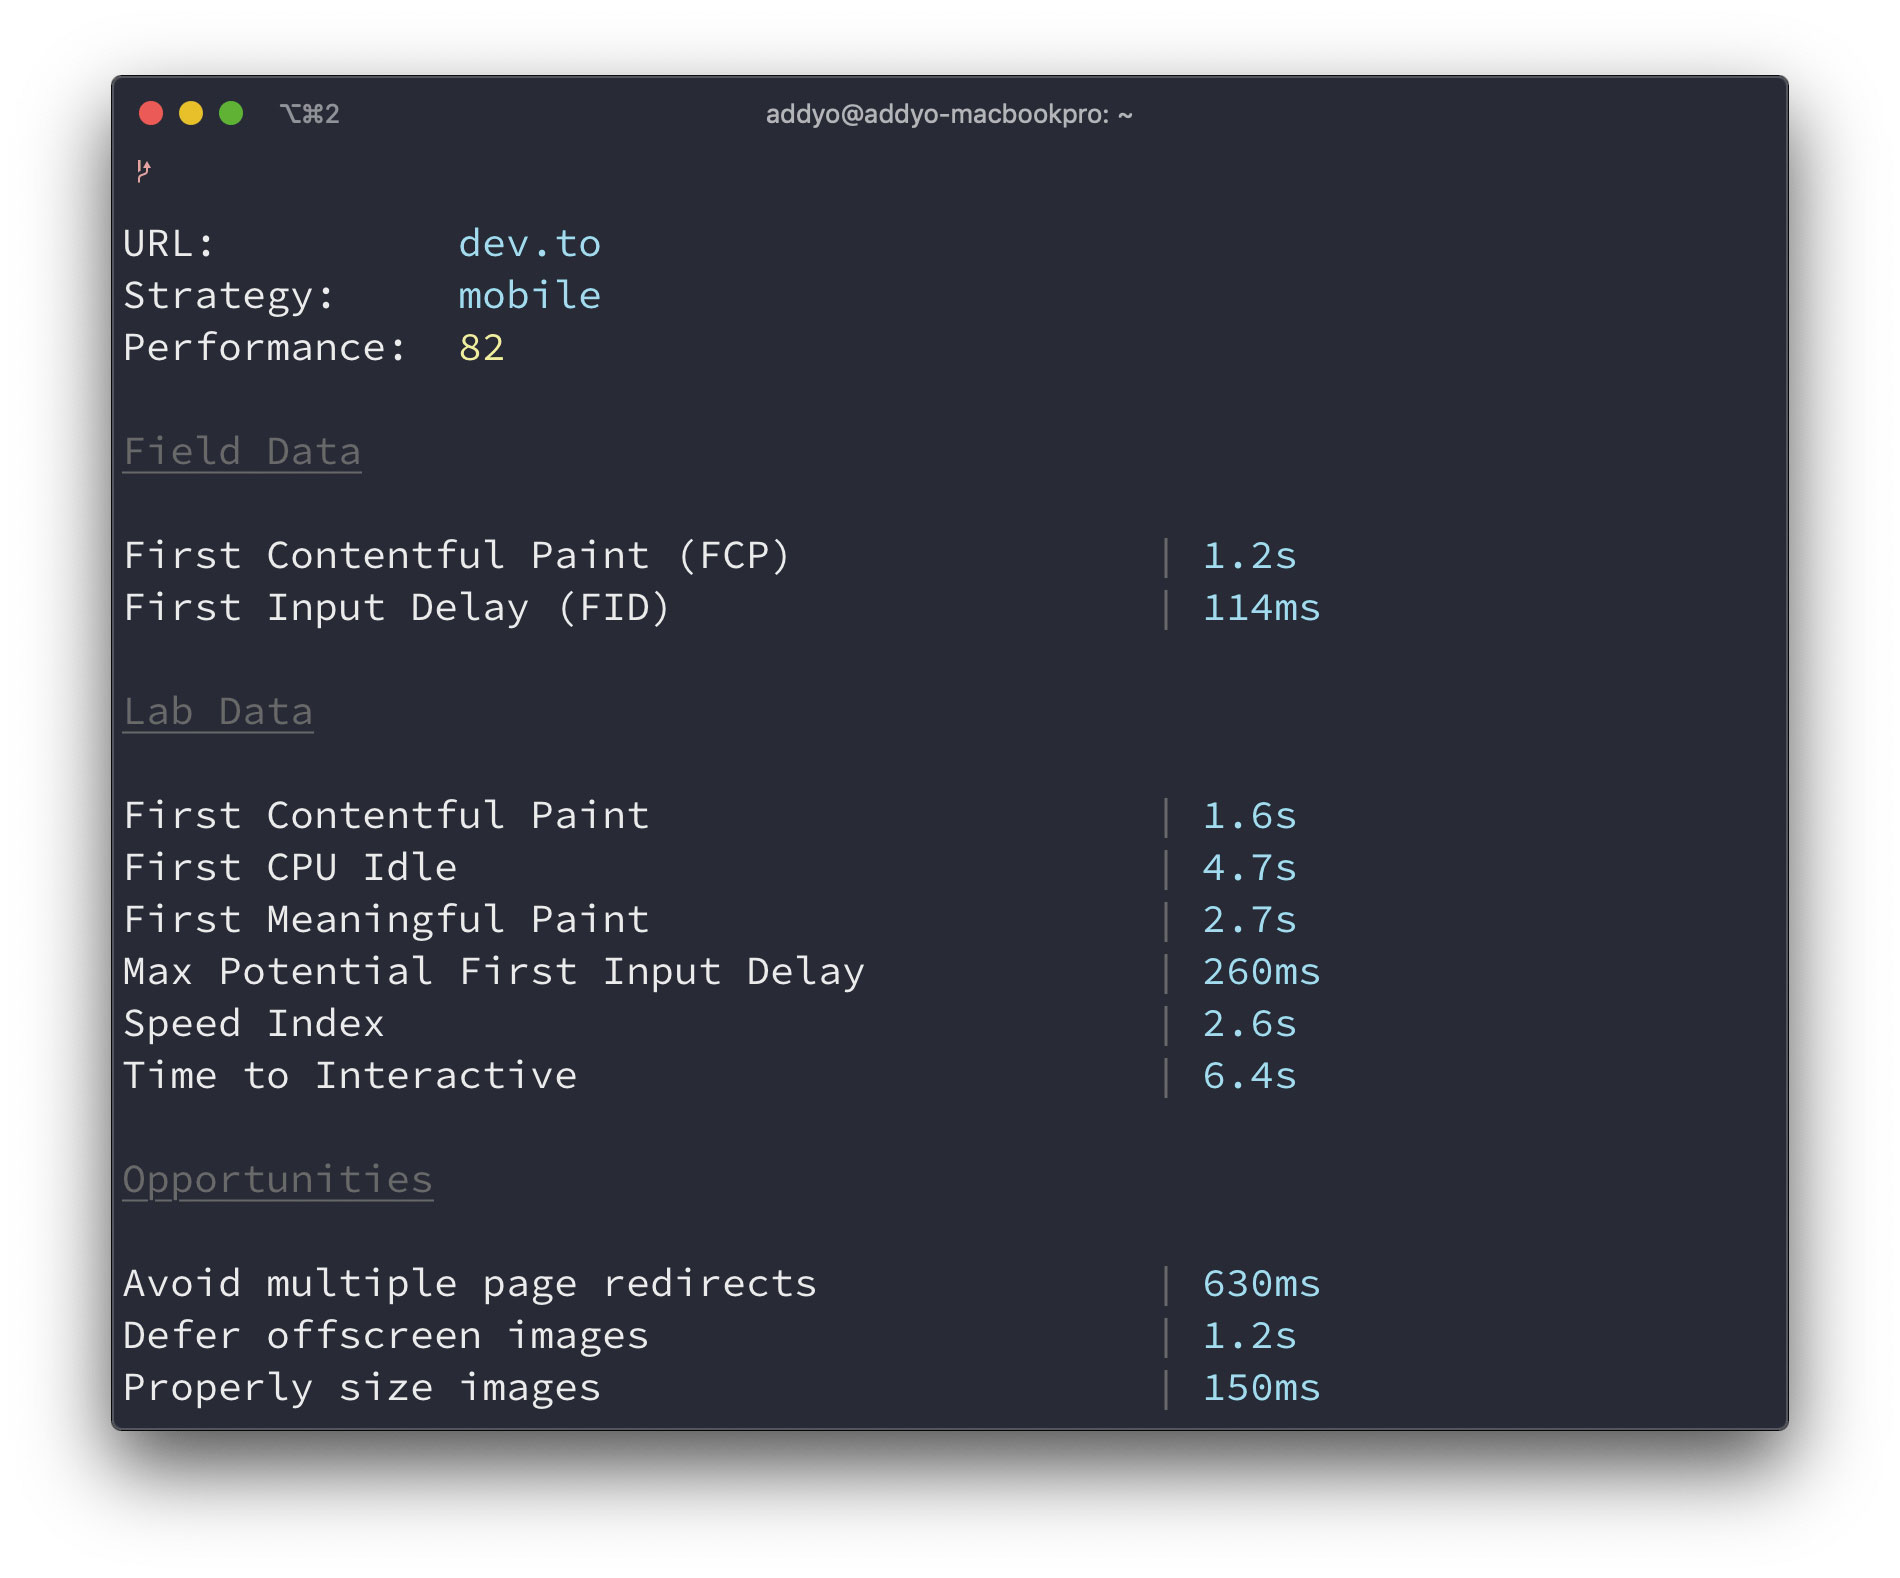
One of the tools we built on top of PSI is the psi Node module, offering convenient performance reporting in your build process.
```js
const psi = require(‘psi’);
(async () => {
  // Get the PageSpeed Insights report
  const { data } = await psi(‘https://web.dev’);
  console.log(‘Speed score:’, data.lighthouseResult.categories.performance.score);
  // Output a formatted report to the terminal
  await psi.output(‘https://theverge.com’);
  console.log(‘Done’);
})();
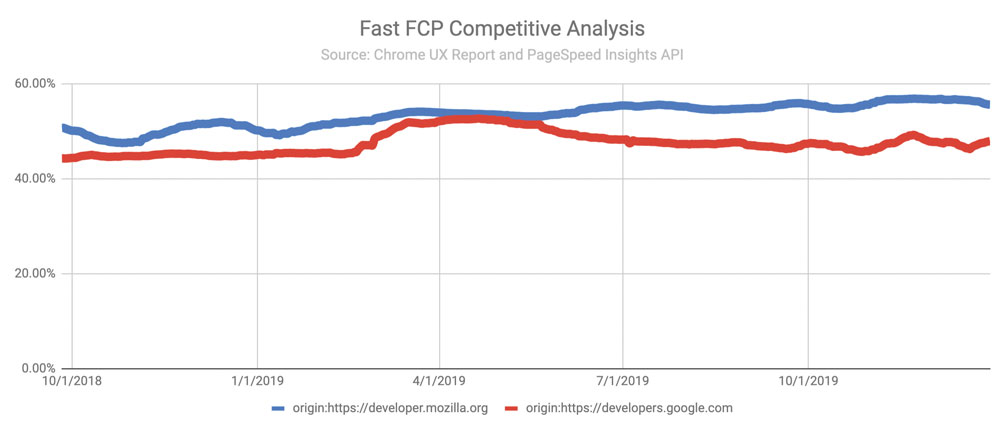
You can also use Google Sheets and a cron job to automate monitoring multiple URLs (eg competitors) by regularly pinging the PSI API. A handy guide and sheet you can copy are available here.
Third-party services
Continuous monitoring services such as SpeedCurve, Calibre or Treo leverage tools like Lighthouse and PageSpeed Insights under the hood. If you'd rather have a service take care of regularly checking your performance scores and send you reports versus rolling your own, consider checking them out. Ultimately, use whichever solution makes the most sense for your site!
Equally as important, is somewhere secure to store your assets. Check out the best cloud storage options for you.
Get fast, stay fast!
When it comes to user experience, speed matters. It's vital to understand the different insights offered by performance metrics, then establish the ones that are important to your user experience. Tools like Lighthouse and PageSpeed Insights can measure your experience and highlight opportunities for where to improve. They can be a helpful part of your site's toolbox for getting fast and staying fast.
Read more:
- Responsive web design: Really useful tutorials
- JavaScript: Some top examples of JS
- CSS animation: Our pick of outstanding examples of CSS

Thank you for reading 5 articles this month* Join now for unlimited access
Enjoy your first month for just £1 / $1 / €1
*Read 5 free articles per month without a subscription

Join now for unlimited access
Try first month for just £1 / $1 / €1
