Improve your UX with Google Analytics
Discover how you can use analytics to boost traffic and increase user retention.

Web analytics can be an incredibly useful web design tool when it comes to improving your user experience. The tools have matured and there's so much information out there about how to use them, so now is a great time to get started working with them.
With web analytics, user researchers can look at much larger sample sizes than is possible with more resource-intensive methods, such as usability testing. This can be useful if you need to establish a high degree of certainty that a particular design change will be effective before you implement it. Analytics also gives researchers an opportunity to come up with answers much quicker than is possible when using in-person activities.
On the other hand, analytics data can't tell you why people acted the way they did. You can only infer people's intent and you can describe what their behaviour actually was. Analytics data works best when used as the starting point for a hypothesis, and is combined with other kinds of research data.
When it comes to web analytics, the specific tools you use are less important than understanding what kinds of data they collect and how to use that data. This article will focus on Google Analytics, but the information is applicable to pretty much any analytics tool. We'll focus on two areas that can be useful for user research: characterising user behaviour, and inferring users' intent.
Characterising user behaviour
What are people actually doing on your website? Finding out this information can help you in a number of different ways. You can use it to discover potential problem areas, prioritise the areas of your website you need to invest design effort in, construct realistic tasks for usability testing, flesh out personas, add evidence to research findings and usability inspections, or assess the effectiveness of a design change.
This kind of analysis typically arises when a business stakeholder gets curious about how people interact with the organisation's website and wants the UX team to look into it. It can also be useful when you're redesigning part of a website and want to gather information about what may be wrong with the original version of the design.
Behavior Flow

The Behavior Flow report (pictured above) shows how people move from page to page. It's a pretty good solution to a difficult information visualisation problem. Starting on the left, you follow the paths people take across pages, where they branch off into different directions, and where they leave the site.
Get the Creative Bloq Newsletter
Daily design news, reviews, how-tos and more, as picked by the editors.
This report focuses on the most common paths that people take – otherwise, there would be too much data to show. For most websites, even the most common paths still represent a minority of users.
The value of this report is in choosing specific pages and looking at the next few pages that people go to. You should look for people:
- Going to a page you wouldn't expect: this indicates potentially misleading navigation. It suggests it's hard for your users to find what they're after, or that you don't understand what they actually want to do
- Exiting the site in large numbers: this can indicate unhappiness or frustration, or it could indicate satisfied users who have completed their task
- Going back and forth between pages: this can also indicate potentially misleading or confusing navigation, where people click on a link, decide they don't want that page, and go back to try again
Navigation Summary
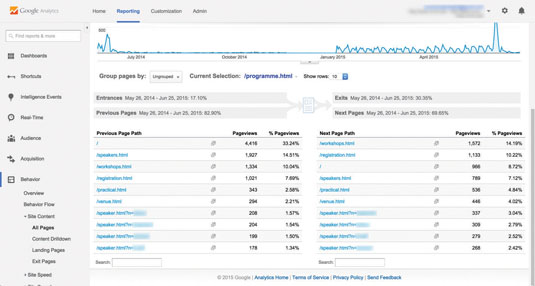
Behavior Flow doesn't show you a lot of detail, and it doesn't show you how people got to your page. The ability to see which pages people came from to reach your site is valuable for uncovering relationships between pages. When you need an exhaustive list of pages people navigate to and from, you use the Navigation Summary report.
For any specific page, the report presents two columns listing users' previous and next pages, and the portion of pageviews coming from each page. Instead of just a handful of examples, you can see every link people clicked on to get to a page on your site.
Events Flow
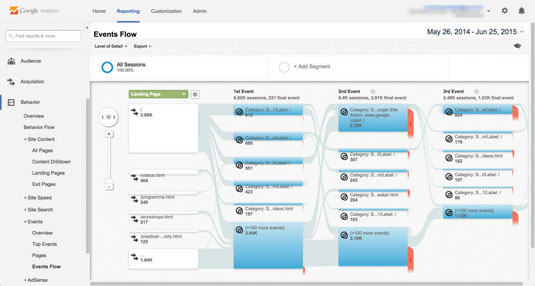
It's worth noting that not every action on a website takes the user to a new page – this is particularly the case with highly interactive websites. That's why Google Analytics offers event tracking. Events can be any kind of user action you want to track with analytics, but they're typically actions that would otherwise be invisible to analytics, like clicking a button that doesn't take the user to another page. In this case, you will have to do some additional configuration to track what people are doing, and may need the help of a technically minded person.
In Google Analytics, the reports you would look at are organised under Events. These can tell you how many times people take the actions you're measuring, and where on the site they do so. There's even an Events Flow report that works like Behavior Flow.
Inferring intent
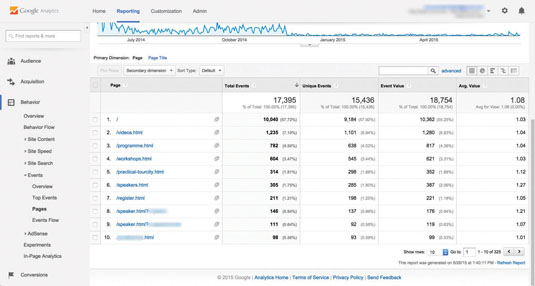
One of the things you may want to learn about your users is what they came to the website to do, or what they're trying to accomplish on a particular page or part of the site. Of course, web analytics alone can never tell you for sure what users want. What it can do is give you evidence to form or support a theory.
Tools like Google Analytics provide you with multiple ways to learn what people may have on their minds. Looking at what pages people view can help you understand their overall goal in coming to the site or what they're trying to do on a particular page.
Looking at the things people search for can be particularly useful, as this provides you with insights into users' goals using their own words. You can also look at where people came from to get to your site for clues about why they decided to visit.
Inferring intent from navigation
One way of forming theories about what people are trying to accomplish is by looking at what they actually click on. This approach isn't perfect, of course – you never know if people navigate to a page because they want to read what's there or because they think they want to read what's there. That's one of the reasons why analytics data goes best with other kinds of user research.
All Pages
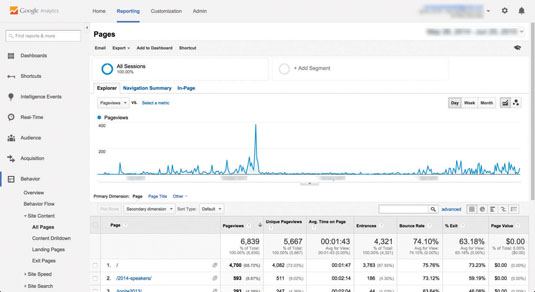
Let's start by getting an overview of what content people find interesting. The All Pages report in Google Analytics shows all the pages people view, and by default it sorts them from most-viewed to least-viewed. Just looking at the most commonly viewed pages can help you understand what content people want to see.
However, keep in mind that there may be pages that people have to visit, like the homepage or search results. Instead, focus on pages that contain information or that let users do things.
Besides providing evidence of the relative level of interest in different pages, you can also see that All Pages shows you a set of metrics that give you an overview of how people use the pages. Let's dig into them.
Pageviews tells you every time anyone looked at a page, and unique pageviews tells you how many individual people looked at a page at least once. So if one person views a page five times, that would be five pageviews and one unique pageview. By comparing the number of pageviews for a given page with the number of unique pageviews, you get a sense of whether people are viewing pages multiple times in a single session or if they tend to view pages only once.
You can also get a sense of engagement with the pages on your site through average time on page and bounce rate.
- Average time on page: tells you the average amount of time that people spent viewing a given page
- Bounce rate: tells you how many people entered your site on that page, then left without doing anything or going to another page
Look for pages that have engagement metrics that are much higher or lower than other pages or the overall average, and consider why that might be the case.
Navigation Summary
As well as looking at what content your users are interested generally, you can also take a specific page and find out how people got there. That's where the Navigation Summary report comes in. Look at the previous pages and try to understand why people may have moved from one page to the next.
Inferring intent from search
Another good way of getting clues about what people want is to look at what they search for in search engines and on your site. For search engine data make sure Google Webmaster Tools is installed properly and connected to Google Analytics. What you'll get from this integration is access to what searches brought people to your site (Search Engine Optimization > Queries report).
Site search data is in the Search Terms report. Feeding data into this report requires a bit of setup in Google Analytics so it receives the data properly. This report gives you a wealth of data – far more than we have space to discuss here – about not just what people searched for, but how they behaved after doing their searches.
In both cases, you can get an overview of the actual words people use to describe their information needs, and the number of people that search for each phrase. Are people looking for things that your website doesn't have? Does the language on your website match the language people use? When you perform these searches, does the page you get match what users seem to be looking for?
Look at the relative proportions of how many people search for each phrase. Does the proportion of searches reflect how important you think these topics are to users?
Inferring intent from where people came from
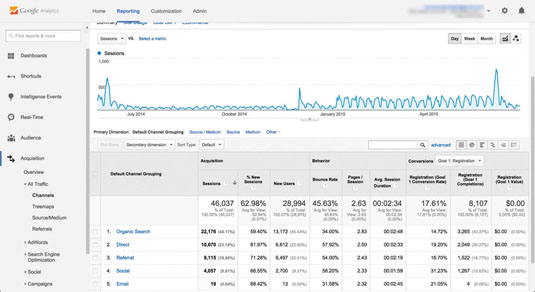
In Google Analytics, the key to inferring people's intent from where they came from is the Acquisition reports. Google has a variety of interesting reports in this section corresponding to the different ways people get to your site. Each has its own nuances, but with the exception of the Social reports, they work in similar ways. As an example, we'll take a look at how to interpret the Referrals report.
Referrals
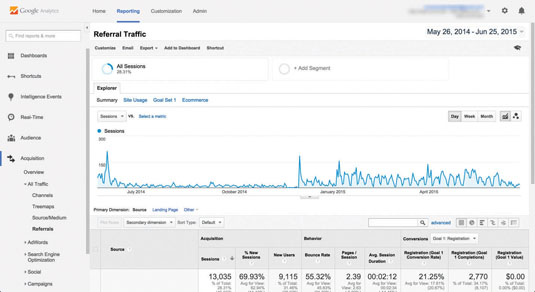
The Referrals report takes only the traffic that comes from websites that link to yours and shows you what websites they came from. Looking at this list of referrers can give you clues about why people come to your site.
The conclusions you draw will vary based on what you see in this list – do you see informational sites where people may be researching a concept, like Wikipedia? Or maybe product review sites, indicating they may be shopping for something? Are they coming from a news site, or a personal site?
Look at the proportion of people coming from each of these referrers. How does this match your expectations about how users get to your site? This report also has high-level metrics that characterise the people coming from these different channels.
Bounce rate, pages/session and average session duration give you an overview of how engaged people are:
- Bounce rate: tells you what portion of your users come to your site and leave without clicking on anything, which can indicate a lack of engagement
- Pages/session: this describes how engaged people are on your site, showing you the average amount of pages they look at during their visit
- Average session duration: this shows how long users spend on your site
As before, look for metrics for individual referrers that are much lower or much higher than the overall average, and try to think of an explanation based on the context of the referrer. Is it a blog post that links to your site, causing people to checking it out briefly? Or is it a partner company's website sending people over to do some business?
Then there are goals and conversions. A goal measures whether or not users took an action on your site that's important to your business, like completing a purchase or signing up for an account. In a perfect world, goals reflect things that are both important to the business and important to users. Conversion rate is the portion of your users that complete one of these goals.
What these metrics tell you is how many of your users (divided by channel) either had a good enough experience to accomplish some important action, or were motivated enough to try. By looking at conversion rate segmented by referrers, you can get a sense of which sites are sending people who are in a state where they're likely to take the action you're aiming for (e.g. they might be prepared to buy something).
Part of your analysis may be to go to the site that's pointing people to your page and find the link so you can see the context. You can find out what specific page the link is on by clicking the 'Secondary dimension' button, opening 'Acquisition' and selecting 'Referral Path'. This will break down the list of referrers so you can see what pages people were on when they clicked on a link to your site.
Conclusion
We've only scratched the surface of what web analytics can tell you about your users. There is a huge amount of information waiting for you, and the best way to learn is by doing.
Make sure you have access to analytics for your website, and when you have questions about users, you should ask yourself if it's something that analytics can help you discover. With practice, you'll get more comfortable and find that analytics fits in well with other user research approaches.

This article originally appeared in net magazine. Subscribe here.

Thank you for reading 5 articles this month* Join now for unlimited access
Enjoy your first month for just £1 / $1 / €1
*Read 5 free articles per month without a subscription

Join now for unlimited access
Try first month for just £1 / $1 / €1
