Make better websites with browser developer tools
Inside every browser are tools to aid developers. Andi Smith shares his tricks and secrets for optimising your development workflow.
Once upon a time, debugging a web page involved inserting copious amounts of alerts into our JavaScript, hitting refresh, and then hammering every alert box OK button until we found the information we wanted. Thankfully, over the years, debugging a website has got easier, with the main browsers making specialist, built-in tools available to developers.
Browser developer tools allow us to inspect, edit, debug, log and profile our HTML, CSS and JavaScript, and include an exhaustive range of features and functionality to aid us in these tasks. You can improve your development workflow by getting to know how these tools work in every browser. Below are 20 tips, split into three categories (beginner, intermediate and advanced) to help you get started.
For beginners
01. Log multiple console values in different formats
If we use string concatenation in our logs when debugging objects and arrays, the console will return the string value of an object. Instead, log multiple values from console.log by supplying multiple arguments:
console.log('Object output: ' + myObject);
// returns Object output: [object Object]
console.log('Object output:', myObject);
// returns Object output: Object {key: "value", key2: "value"}
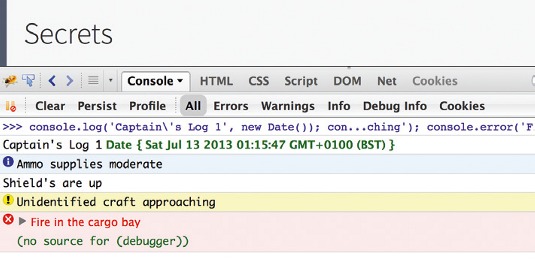
As well as the standard log, there are other types of logging available, which can help you to distinguish between the different types of console information:
console.log('Captain\'s Log 1', new Date());
console.info('Ammo supplies moderate');
console.debug('Shield\'s are up');
console.warn('Unidentified craft approaching');
console.error('Fire in the cargo bay');
You can preserve logs between pages in Chrome and Opera 15 by right-clicking on the console output and selecting Preserve Log Upon Navigation. In Internet Explorer (IE), this option is available in the Tools menu bar, under Clear Entries On Navigate.
In Firebug, the Persist option above the console will keep the console history. Currently, Firefox preserves console logs by default. In a future version, this option will be in the Settings menu.
02. Use the console in any panel
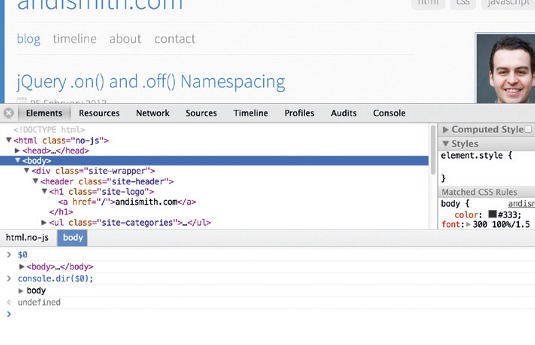
You can run an instance of the console from any of the other panels in Chrome, IE11, Opera 15 and Safari.In Chrome and Opera 15, press the Esc key. In IE11, the keyboard shortcut is Ctrl + '. Safari has a small console prompt available below the main panel by default.
Daily design news, reviews, how-tos and more, as picked by the editors.
Combining the console alongside tabs such as the DOM Inspector and Scripts panel can provide a very powerful way to inspect what's happening within your DOM and scripts.
03. View your site as responsive
There are various options available for testing responsive pages in the browser in addition to the traditional method of simply resizing the browser.
In Chrome, Firefox, Opera 15 and Safari 6.1, docking the tools to the right enables users to achieve finer control over resizing their content, while also facilitating full use of the tools.
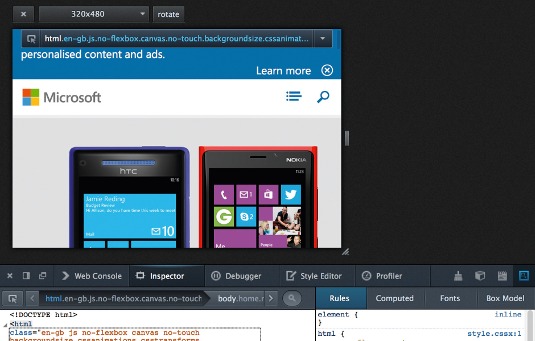
In Chrome and Opera 15, the option to dock to right is found to the bottom left of the tools: clicking and holding the Dock button will enable you to select between three docking options. In Firefox, the Dock To Right button is in the top-left of the toolbar, next to the Close button; in Safari 6.1, it's located in the top right-hand corner and is only available once you've undocked the tools.
Chrome, Firefox, IE11 and Opera 15 also include dedicated responsive modes, which can be used to set the browser window to a defined width and height. This has the advantage of displaying how much content will be shown in the default viewport area.
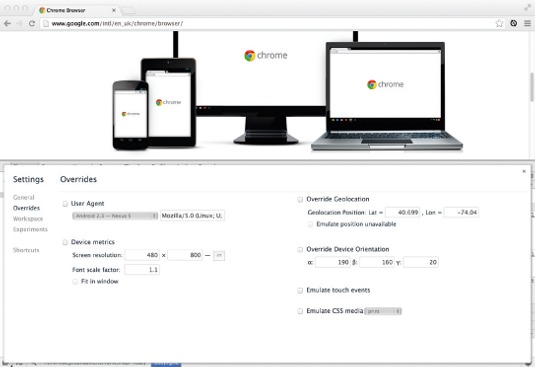
In Chrome and Opera 15 developer tools, open the Settings menu (the cog found in the bottom right) and select the Overrides tab. In this tab is an option called Device metrics that allows us to specify our own width and height. Alternatively, if you tick the User Agent option and select a device, it will automatically fill in the correct dimensions. You can then untick the User Agent option if you don't require it. In Firefox, the Responsive Design Mode is the top-right icon in the menu. Choosing this option presents a smaller viewport with a drop-down to choose different device dimensions. In IE11, this mode can be found in the Emulation tab.
04 View available CSS properties
In Chrome, IE11, Opera 15 and Safari, you can view the available CSS properties on an attribute by pressing Ctrl and Space when the CSS attribute field is blank.
05. Reference DOM elements from the console
While working in the console, we may need to reference an element from the DOM. There are various shortcuts to select elements quickly.
We can retrieve a single element by using $. For example, if our element had an ID of magazine, we would type $('#magazine'). If it had a class of latest, we would type $('.latest');.
Here, $ is shorthand for document.querySelector. Therefore, it only returns the first match rather than an array of matches as in JavaScript libraries such as jQuery. If the $ variable is already in use, then this functionality is overridden by the library using it.
In some older browser developer tools and in IE11, $ will retrieve an ID, while $$ is used to retrieve a class. In these cases, the hash or dot are not required. For example:
$('magazine');
$$('latest');
Tools that have the newer functionality will warn you if you use the old syntax.
06. Reference the current or previously selected DOM element
If you have an element currently selected in your DOM, you can use the reference $0 to call it within your code. For example, to see the current element's inner HTML, you would type the following: $0.innerHTML.
In Chrome, Firebug 1.12, IE11, Opera and Safari, you can retrieve elements you have previously highlighted by using $1 - $4. In Firebug, you can use $n(2) - $n(5).
07. Set conditional breakpoints
Rather than hitting a breakpoint whenever we reach a line of code, we can set a breakpoint to trigger based on whether a particular expression is true.
We can create a conditional breakpoint within our script panel by creating a normal breakpoint, right-clicking and selecting Edit, Condition... or Add conditional breakpoint (depending on the browser). This can be especially useful for breakpoints set within loops. For instance, by adding a conditional expression of i = 10, we'll hit the breakpoint only when this expression is true.
08. Debug minified code
Placing breakpoints on JavaScript makes debugging much easier, but if your code has already made it to production then it may have already been minified. How can you debug minified code? Helpfully, some of the browsers have an option to un-minify your JavaScript.
In Chrome and Opera 15, simply select the Sources tab, find the relevant script file and then press the { } (Pretty Print) icon that's located within the bottom panel.
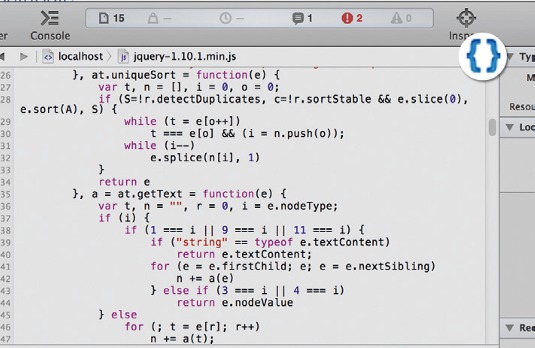
In IE, click the tool icon by the script selection drop-down to find the option to format the JavaScript. Older versions of Opera and Safari 6.1 will automatically un-minify your code.
Intermediate level
09. Use logging based on expressions
We can use console.assert() to provide conditional logging on our pages. Assert works by evaluating an expression, before logging a console message if the evaluated expression is false. If the expression is true on the other hand, no message is logged.
For example:
var i = 11;
console.assert(i < 10, 'Unexpected value for i: ' + i);
// returns Assertion failed: Unexpected value for i: 11
At the time of writing, assert is supported in all browser developer tools (including Firebug) except Firefox Developer Tools.
10. List the properties of an object
Using console.dir(obj) produces a list of properties available on an object. The properties are interactive; they can be altered on the fly. This feature is especially useful with DOM objects (for example, document), as traditional console log commands show the HTML output rather than a list of object properties.
11. Profile JavaScript from the console
We can profile parts of our JavaScript to find performance bottlenecks directly from the console via two different approaches.
By using console.time, we can perform a quick analysis of the time taken to run our code, while console.profile provides a greater breakdown by showing how long it took the individual functions to run.
To use the timer, we need to provide a label as a parameter to console.time. The label allows us to run multiple timers concurrently:
console.time('timer 1');To end the timer, we provide the same label to console.timeEnd:
console.timeEnd('timer 1');At this point, the console will log the number of milliseconds the timer had been running for.
console.profile works in the same way, with a corresponding console.profileEnd method. However, the report produced after running it is much more detailed. Depending on the browser developer tool, the profile will either be logged out to the console or, in the case of Chrome and Opera 15, to the Profiles tab.
12. Log data in a table
If the data we are logging to the console is a multidimensional array, or an object, we can use console.table in Chrome, Firebug and Opera 15 to output the data into a table we can sort.
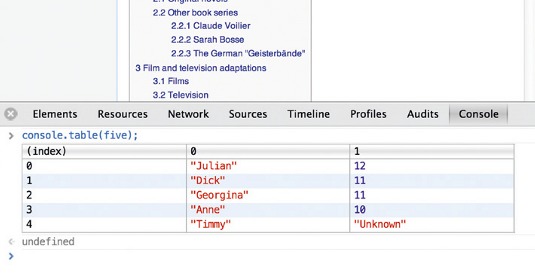
To log a multidimensional array as a table:
var five = [["Julian", 12], ["Dick", 11], ["Georgina", 11], ["Anne", 10], ["Timmy", "Unknown"]];
console.table(five);
Logging an object as a table works in the same way, except that property names can be used for column and row names. Alternatively, we can add a second argument to specify which columns to output. For example, see the following:
var devtools = {"chrome": { "creator": "Google", "version": 28 }, "firefox": { "creator": "Mozilla", "version": 22 }, "internet-explorer": { "creator": "Microsoft", "version": 11,"plugins":"Silverlight" }};
console.table(devtools, ['creator','version']);
If a property is missing from an object, the table will display undefined for this table cell.
13. Run snippets of code
Sometimes when debugging we want to run the same snippet of code continuously against our page; at other times it would be handy to include a saved snippet to help us debug our code. We can run any JavaScript code from the console already, but both Chrome, Opera 15 and Firefox also enable us to save these snippets so that we can use them again and again.
You can find Snippets in the Sources tab of Chrome and Opera 15 dev tools, in the left-side menu after Sources and Content Scripts. Here you can create new snippets and run previously created snippets, provided as a list accessible by all your sites. In Firefox you'll need to use Scratchpad, which allows us to load, save and run JavaScript snippets by making use of the more traditional file system method.
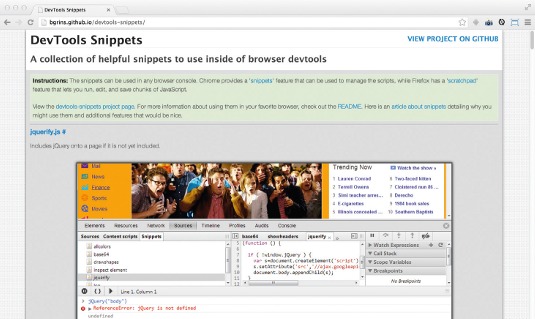
Find a list of useful snippets for tasks such as adding jQuery to a page and listing all colours here.
14. Emulate a touch device
Building a site for smartphones within a browser can be difficult, especially if you have to provide touch-specific functionality like swiping.
In Chrome and Opera 15, you can pretend to be a device that supports touch and emulate touch events directly within the browser. In order to do this, open the Settings menu, select the Overrides tab and then Emulate touch events.
In Chrome, this option will also replace the cursor with a circle. You can then tell not only which mode you are in, but also how large the surface area for a touch click should be based on Apple recommendations.
15. Emulate a print stylesheet
While checking styles for print in the past, we would have to rely on Print Preview or Print to PDF. Recent versions of Chrome allow us to emulate the media type so we can see how print (or any of the other media types) looks directly in our browser. To do this, open the Chrome Developer Tools Settings menu and choose the Overrides tab. At the bottom of the list of options is Emulate CSS media. Select the checkbox and choose Print.
16. What have I changed?
If you've made a number of changes to your CSS or JavaScript within your developer tools, it can be difficult to keep track of what you've already changed. In the Sources tab of Chrome and Opera 15 developer tools you can find out what modifications have been made by opening the Sources side panel, right-clicking and selecting Local Modifications. A list of the changed files will be displayed, together with timestamps for when they were changed.
By expanding any one of these changes you are given a before/after comparison. You can also reverse any changes you are no longer happy with. By right-clicking on the file, we can save the new CSS or JavaScript file.
Advanced
17. Export network data
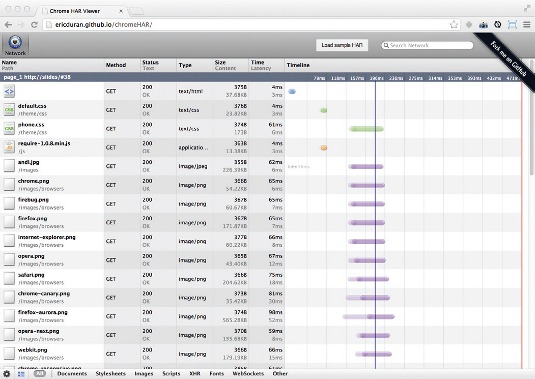
If you've ever had a situation where a page works fine on your own machine, but on a machine in another location an image is missing or a piece of content does not load correctly, then being able to view that machine's network traffic can help us to debug the problem. In Chrome and Opera 15, we can export the network timeline by right-clicking within the Network tab and selecting Save as HAR from the context menu. HAR stands for HTTP Archive, a format for storing network traffic from our site. You can duplicate the effect in other browsers by running a network monitoring program such as Fiddler or Charles and exporting the HAR from there.
We can then attach this to a bug report and load this HAR file on another machine by using a HAR reader such as chromeHAR.
18. Use Sass source maps
Preprocessors such as Sass are popular development aids, but the output they generate can be difficult to work with in the dev tools. For example, the line numbers in your style panel won't correspond to the ones in your Sass file. Debugging gets much harder if you use minification to remove unnecessary characters (such as comments and newlines) and uglification to optimise and shrink variable names.
Using source maps we can map our generated CSS and JavaScript files back to the source, giving us more control when debugging in developer tools. Sass 3.3 and above come with full support for source maps. First, check that you have version Sass 3.3 or above running by entering:
gem list sassIf the version is younger than 3.3.0.alpha, you can run an install with:
gem install sass --preDepending on how you compile your Sass files, there are various ways to create .map files. Two of the most popular are with the Sass watch command and with Grunt.
If you're using Sass watch, you need to add the --sourcemap parameter to your command:
sass --watch scss/common.scss:css/
common.min.css --style
compressed --sourcemap
If you're using the Grunt grunt-contrib-sass module, specifying the option sourcemap: true will compile source maps during build.
In Chrome, you need to enable the Experiments tab. If you haven't done so already, navigate to chrome://flags and choose Enable Developer Tools experiments. You'll need to press the Relaunch Now button at the bottom of the page to apply your changes.
Now go to the Settings panel of the developer tools, click the General tab and activate Enable source maps. Click the Experiments tab and check Support For Sass.
After restarting your browser, you will now be able to view line numbers of the Sass files directly.
19. Use JavaScript source maps
Like Sass source maps, the JavaScript equivalent provides a map back to the original formatted source. We can create a JavaScript source map using various different tools such as Google's Closure Compiler or Grunt's Uglify plug-in that builds .map files for you. RequireJS also has experimental support for source maps.
When using Closure Compiler, we need to run the following :
java -jar compiler.jar --js common.js --create_ source_map ./common.js.map --source_map_ format=V3 --js_output_file common.min.jsWith Closure Compiler, we also need to add a sourceMappingURL with the name for a map file to the bottom of our JS minified file:
//# sourceMappingURL=common.js.mapThe sourceMappingURL property is currently going through a syntax transition due to a problem found with compatibility in IE. So while the most up-to-date syntax is //#, some older browser versions may still expect //@. In Grunt, we specify our source map in the options for grunt-contrib-uglify as sourceMap: // path to map file. In Chrome Developer Tools go to the Settings menu and within the General tab activate Enable source maps. Now when you debug your JavaScript, you can use the un-minified version to see what's really going on, while still providing your minified version to your end users.
20. Try Chrome's Workspace
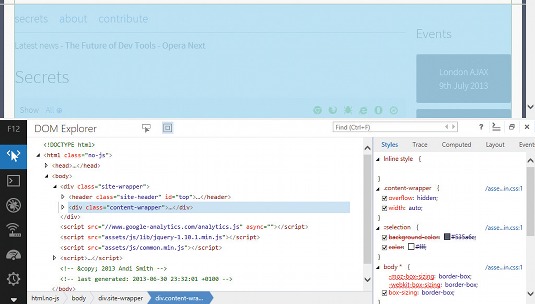
Chrome has recently introduced Workspace, a highly requested feature that allows you to make changes from the developer tools and automatically update your source files.
To enable Workspace, you'll first need to go to chrome://flags and Enable Developer Tools experiments. After re-launching Chrome, go to the developer tools Settings menu and select the Experiments tab. Check the box File system folders in Sources Panel before closing and reopening Chrome again.
Back in the Settings menu select the Workspace tab. Select Add File System and add the directory where your files are loaded, giving Chrome permission to access the directory.
Now, go to the Sources menu and right-click on one of your CSS or JavaScript files. Select Map to Network Resource and from the file list that appears and choose the file that matches your selection. You can now make changes to your CSS and JavaScript from within the developer tools and your files will automatically update.
Keeping updated
Finally, by using the latest browser developer versions, you can use current features and offer feedback on how to make these tools better. Following the links below to ensure you download the latest versions.
Happy debugging!
Words: Andi Smith
This article originally appeared in net magazine issue 246.
Liked this? Read these!
- Our favourite web fonts - and they don't cost a penny
- Inspiring ecommerce website designs
- Check out these excellent HTML5 examples

Thank you for reading 5 articles this month* Join now for unlimited access
Enjoy your first month for just £1 / $1 / €1
*Read 5 free articles per month without a subscription

Join now for unlimited access
Try first month for just £1 / $1 / €1

The Creative Bloq team is made up of a group of art and design enthusiasts, and has changed and evolved since Creative Bloq began back in 2012. The current website team consists of eight full-time members of staff: Editor Georgia Coggan, Deputy Editor Rosie Hilder, Ecommerce Editor Beren Neale, Senior News Editor Daniel Piper, Editor, Digital Art and 3D Ian Dean, Tech Reviews Editor Erlingur Einarsson, Ecommerce Writer Beth Nicholls and Staff Writer Natalie Fear, as well as a roster of freelancers from around the world. The ImagineFX magazine team also pitch in, ensuring that content from leading digital art publication ImagineFX is represented on Creative Bloq.
