Create a JavaScript bar chart with D3
Scott Murray, author of Interactive Data Visualization for the Web, demonstrates how to visualise data using the browser-based tool D3.js.
D3 (Data-Driven Documents), also known as D3.js, is a powerful tool for creating data visualisation within the browser. It’s a JavaScript library that leverages web standards that you already know to create future-proofed interactive visualisations that don’t rely on browser plug-ins. Start by downloading the code and opening up 00_page_template.html in a current browser. (You may need to view pages served through a web server, for example http://localhost/.)
Selection and creation
The page template provides only a reference to D3. Notice that the ‘body’ of the page is empty.
Open up the JavaScript console, and type in your first line:
d3.select("body")
Everything in D3 begins with a selection. You select something first; then you can tell D3 what you want to do with it.
D3’s select() and selectAll() methods both use CSS selector syntax (just like jQuery), so you can quickly identify any DOM element or elements you like. select() selects only the first element found, while selectAll() returns all matching elements.
We’ve selected the body; now let’s add something to it:
d3.select("body").append("p")
append() creates a new element inside the end of whatever selection you give it. So here, we create a new p paragraph at the end of the body.
Let’s throw some text into that paragraph:
d3.select("body").append("p").text("Hello, world!")
Now you should see "Hello, world!" rendered in the browser.
Well, hello!
All your data are belong to arrays
Switch to 01_data.html for a refresher on storing data in JavaScript. The simplest storage is one value in a single variable:
var value = 5;
Arrays can store multiple values. In JavaScript, arrays are defined with hard brackets:
var arrayOfValues = [ 5, 6, 7, 8, 10, 12, 22 ];
D3 is supremely flexible about data — as long as it’s in an array. Within an array, mix and match as you please. Instead of single values (as above), you could use objects.
Objects store arbitrary key/value pairs, and are defined with curly brackets. Here’s an array of objects:
var arrayOfObjects = [
{ plant: "fern", color: "green", number: 23 },
{ plant: "rose", color: "pink", number: 7 },
{ plant: "dandelion", color: "white", number: 185 }
];
Binding data to elements
I’ll use a straightforward array as our data set:
var dataset = [90, 45, 29, 88, 72, 63, 51, 35, 26, 20];
And I’ll set up some variables for our chart’s dimensions:
var width = 500;
var height = 200;
var barHeight = 20;
The Scalable Vector Graphics image format is amazing because its code is markup, just like HTML.
This simple SVG image contains a square and a circle.
<svg width="100" height="100">
<rect x="0" y="0" width="50" height="50"></rect>
<circle cx="50" cy="50" r="25"></circle>
</svg>
Styling SVG
Because SVG markup is HTML-compatible, all SVG elements will exist in the DOM.
As a result, they can be styled with CSS and manipulated dynamically with JavaScript.
I dare you to try that with JPGs!
Before we can draw anything, we have to create the SVG element inside which all the visual elements will reside:
var svg = d3.select("body").append("svg")
.attr("width", width)
.attr("height", height);
This selects the body and appends a new svg element. Then we use D3’s attr() method to set width and height attributes.
The selection of the new SVG element is passed back into a new variable called svg.
Storing selections this way allows us to reference elements later without having to re-select them.
Finally, brace yourself for D3’s most mind-bending pattern:
svg.selectAll("rect")
.data(dataset)
.enter().append("rect")
.attr("x", 0)
.attr("y", 0)
.attr("width", width)
.attr("height", barHeight);
Ack, what is this? First, within the SVG element, we select all the rect elements. Of course, there are none yet, but we’re about to create them!
Next, we call data(), which binds our data set to the selection. This is the fundamental process of D3: driving documents with data by linking one data value to one element.
For multiple values, we need multiple elements — say, one circle for each number. In this case, since there are more data values than matching DOM elements, data() not only binds the data, but creates an enter selection which represents all the incoming elements that do not yet exist.
Positioning
We use enter() to access the enter selection. Finally, append() fills each empty element with a new rect: these are the elements to which the data values are linked. Finally, several attr() statements set the properties of each new rect.
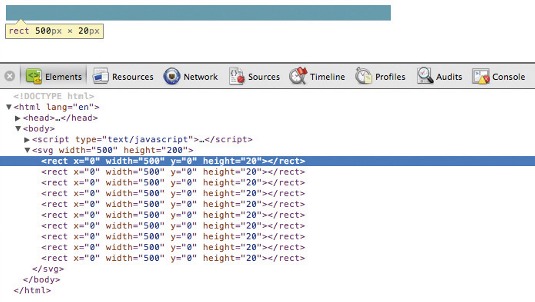
Open up 02_binding_data.html and inspect the DOM. We see there are 10 rectangles, but they’re all positioned on top of each other.
Daily design news, reviews, how-tos and more, as picked by the editors.
This is happening because we set the same x, y, width, and height values for each rect.
To prove that the data is now bound to elements, type d3.selectAll(“rect”) into the console. You’ll see an array of 10 SVG rect elements. Expand each one, and you’ll find a __data__ property, in which lives a data value!
The elements’ values are 90, 45, 29, and so on, just as specified in our original dataset array.
Setting attributes
Let’s rewrite the last four lines of the code above as:
.attr("x", 0)
.attr("y", function(d, i) {
return i * barHeight;
})
.attr("width", function(d) {
return d;
})
.attr("height", barHeight - 1);
All bars will be aligned along the left edge, so we can keep x at zero. But the y values must be spaced out to prevent overlap. To calculate dynamic values, we can specify an anonymous function instead of a static value.
Parameters Notice this function takes d and i as parameters, into which D3 will pass the current datum (the current value in the array) and its index position (0, 1, 2…). Although we don’t reference d yet, we must include it as a parameter so i is given the right value.

Within this function, i * barHeight is calculated and returned as the y value, thereby pushing each successive rect further down the image.
For the width, we take d, the raw data value. And for height, we don’t need a function to calculate a dynamic value, since all bars will be the same height (barHeight - 1).
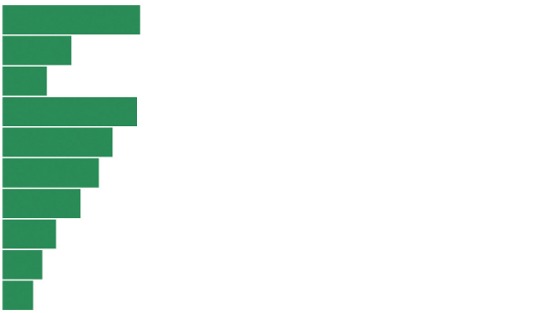
Now check out 03_setting_attributes.html!
Each bar gets a unique vertical position and a width that corresponds to the original array’s data value: a true visualisation!
Scaling data to pixels
This looks better, but the bars are too short. Our SVG is 500 pixels wide, yet the bars cover only a quarter of that.
Say hello to D3’s scales. Scales are customisable functions that map values from an input domain to an output range. We’ll use a scale to map values from the data’s domain (0 to 90) to pixel values (0 to 500).
To define our first scale:
var xScale = d3.scale.linear()
.domain([0, d3.max(dataset)])
.range([0, width]);
domain() takes an array with two values. The first value is the low end of the domain, while the second is the high values. d3.max() is a quick way to get the largest value from an array (90, in this case).
range() also takes as an array of two values, one low and one high. For us, these are pixel units, so we set them to zero and width.
One last thing: when setting each bar’s width, now we need to wrap d in our new scale function:
.attr("width", function(d) {
return xScale(d);
})
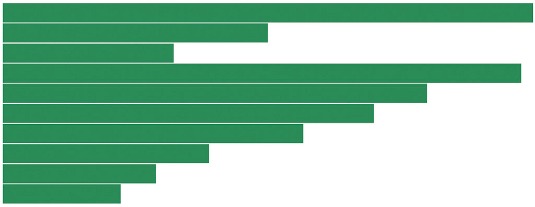
Brilliant! The data values have been mapped to visual pixel values, and therefore our bars now automatically scale to fit the image width.
One step further
Taking this idea one step further, we can use an ordinal scale for the vertical axis.
This keeps our bars’ spacing and height flexible, so they can scale should our data set change in the future. Ordinal scales expect categories, not linear quantitative values, as input.
In this case, the ‘categories’ will be simply the position of each value in the data set: 0, 1, 2, and so on.
var yScale = d3.scale.ordinal()
.domain(d3.range(dataset.length))
.rangeRoundBands([0, height], 0.05);
d3.range() is a handy sequential integer generator, so the input domain here is set to [0, 1, 2, 3, 4, 5, 6, 7, 8, 9], since dataset.length is 10.
rangeRoundBands() sets a banded output range that lines up nicely with pixel values — just what we need to space out the bars evenly, between 0 and height. The 0.05 tells D3 to add 5% for padding between bands.
Later, when setting the bars’ y and height values, instead of calculating those values from barHeight, we now reference our new ordinal scale:
.attr("y", function(d, i) {
return yScale(i);
})
…
.attr("height", yScale.rangeBand());
To specify basic interactions, bind the event listeners to elements using on():
.on("click", function() {
//Do something when this element is clicked
})
on() takes two arguments: first, the name of the DOM event that should trigger the function. This can be any standard JavaScript event. Let’s use mouseover and mouseout to highlight each bar on mouse hover:
.on("mouseover", function() {
d3.select(this).classed("highlight", true);
})
.on("mouseout", function() {
d3.select(this).classed("highlight", false);
});
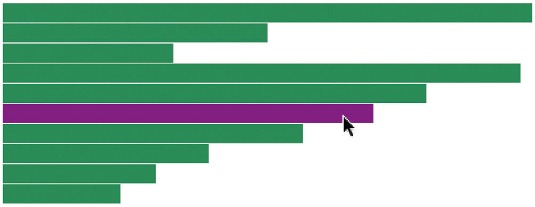
Within each anonymous function, this represents “the current element,” so we can select it with d3.select(this). classed() adds or removes a class from any element. If true, the class will be added. If false, it is removed. Finally, we need a CSS style to recolour the bars when the highlight class is applied:
rect.highlight {
fill: purple;
}
(A colour change on hover like this could be achieved with CSS alone, but event listeners are needed for more complex interactions, like transitions.) Open up 05_interactivity.html: you've made a simple interactive bar chart!
Words: Scott Murray
Interactive Data Visualization for the Web: An Introduction to Designing with D3 by Scott Murray is available to buy from O'Reilly.
This article originally appeared in .net magazine issue 237. Thanks to Mike Bostock for his peer review of this tutorial
Liked this? Read these!
- Delight in these top examples of JavaScript
- The best infographics on the web, for your delectation
- Make your apps work for you! Splendid IFTTT recipes
Any questions? Ask away in the comments!

The Creative Bloq team is made up of a group of art and design enthusiasts, and has changed and evolved since Creative Bloq began back in 2012. The current website team consists of eight full-time members of staff: Editor Georgia Coggan, Deputy Editor Rosie Hilder, Ecommerce Editor Beren Neale, Senior News Editor Daniel Piper, Editor, Digital Art and 3D Ian Dean, Tech Reviews Editor Erlingur Einarsson, Ecommerce Writer Beth Nicholls and Staff Writer Natalie Fear, as well as a roster of freelancers from around the world. The ImagineFX magazine team also pitch in, ensuring that content from leading digital art publication ImagineFX is represented on Creative Bloq.
