The best infographic maker to use
The best free (and paid) infographic maker options.
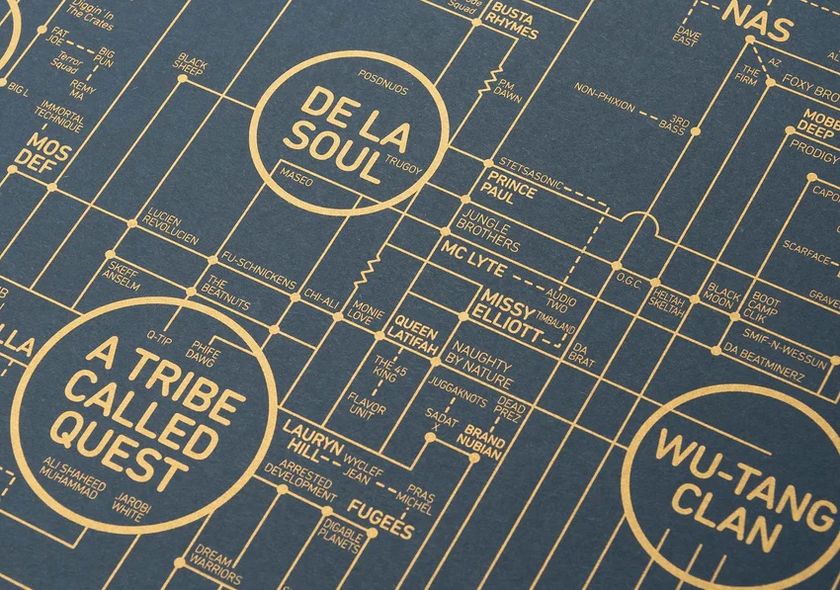
The best infographic maker options can help you present complex data in a simple yet striking visual form. Of course, you can create your own infographic from scratch – but that can be a huge undertaking. The best infographic makers make presenting data much simpler, with a range of flexible, customisable templates.
We've picked out a list of the best infographic makers, including both free and paid tools. While many are are aimed at beginners, even these are often hugely capable. As part of our rigorous review process we've evaluated them according to their easy of use, flexibility and customisation options and value.
If you need some inspiration, just take a look at our collection of the best infographics. And if you do fancy creating your own infographic from scratch, take a look at our guide on how to download Photoshop.
The best infographic makers available now
Specifications
Reasons to buy
Reasons to avoid
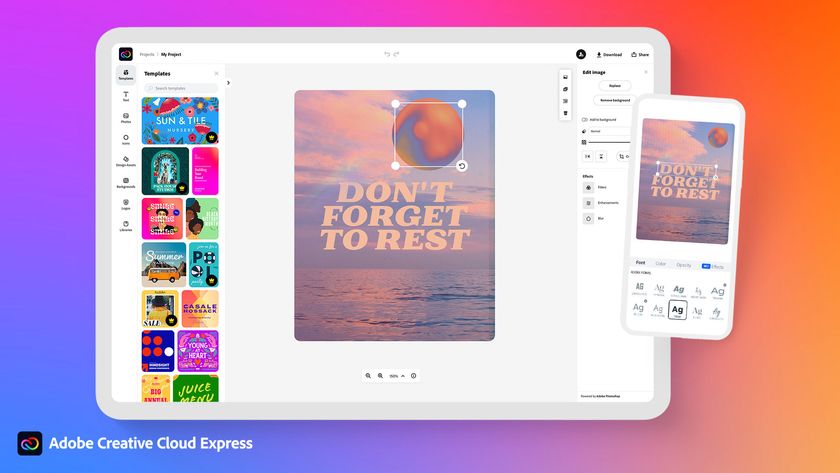
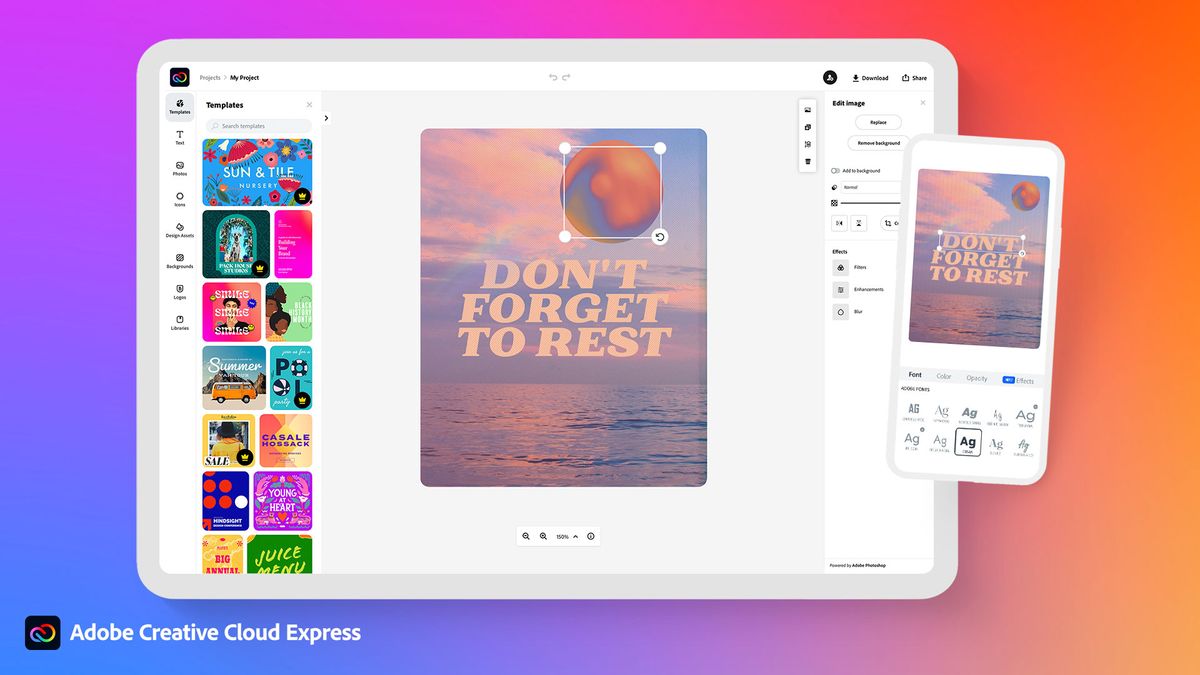
If you need to make infographics quickly and easily for social media, Adobe Creative Cloud Express (formerly Adobe Spark) is one of the best tools around. It has over 10,000 templates to choose from and thousands of free license-free assets to smarten up your design. There's a basic free plan, but as our Creative Cloud Express review explains, you'll need a subscription to unlock all the many features available.
Creative Cloud Express can do a lot more than design just infographics, but it's the best tool that we've found for that purpose for social. It uses a drag-and-drop editor which is super simple to use. Search through the templates to get the one you want, and then start editing. You can add your own background, change the text, add an image, introduce an icon and include your own logo (if you have one). When done, the infographic maker lets you resize for your favourite social platform with a single click, then download (we recommend saving in cloud storage). Sit back and watch your infographic go viral. Get Adobe Creative Cloud now for Adobe's full suite of design apps.
02. Canva Infographic Tool
Our expert review:
Specifications
Reasons to buy
Reasons to avoid
Canva is a powerful and easy-to-use online design tool that's suitable for all manner of creative tasks, from brochures to presentations and much more besides. It also offers users a vast library of images, icons, fonts and features to choose from.
It features a dedicated free infographic maker with hundreds of free design elements and fonts at your fingertips. There are many more premium elements that you can buy for $1. When we reviewed it, we found Canva benefited from being simple to use for all kinds of design work, including infographic creation. At the same time, it offers a good level of customisation for such an accessible tool.
Get the Creative Bloq Newsletter
Daily design news, reviews, how-tos and more, as picked by the editors.
See our full Canva review for more details.
03. Venngage
Specifications
Reasons to buy
Reasons to avoid
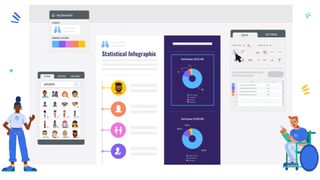
Venngage is one of the most popular picks for those looking for a dedicated tool for making infographics. Our first two picks as the best infographic makers can be used for all kinds of design, whereas Venngage was created specifically infographics in mind (although it covers diagrams and reports and other such pieces too). Thanks to this specialisation it offers a vast number of creative templates for the purpose (more than 7,500, in fact).
It's super-easy to use thanks to a handy image search feature, which makes finding and adding images to your infographics a breeze. Though there's a massive range of features available, including font upload and the ability to export in Powerpoint and even interactive PDF, many of these are only available as part of a Business account (there's a big jump between what you get from a Premium account and the Business plan). However, there is also a fairly decent Free plan, and the Premium subscription gets you everything you need to create attractive infographics with a highly professional look.
04. Snappa
Specifications
Reasons to buy
Reasons to avoid
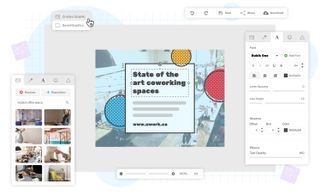
The highly rated graphics tool Snappa is another one that we found super-easy to use, with pre-made templates galore and a library packed full of high-res images – over 4,000,000 to be exact. It lets you remove image backgrounds with a single click and has a range of text effects and graphics to drop in. You can even share to social direct from the program. There's a free plan (you can have one user, 6,000 templates and three downloads a month), and paid-for options from $10 per month offering more features.

05. Piktochart
Specifications
Reasons to buy
Reasons to avoid
If you're after an entry-level infographic maker, Piktochart takes out the legwork of designing an infographic by supplying you with easy to customise templates. Once you've uploaded your stats, you can tweak the layout and colour scheme. Given that infographics are an art form in and of themselves, and one that can be overwhelming at first, Piktochart is a great way to get to grips with the medium. There are various pricing options, including a free account that allows you to make up to five visuals, although you'll have to pay to get rid of the Piktochart watermark.
06. DesignCap
Specifications
Reasons to buy
Reasons to avoid
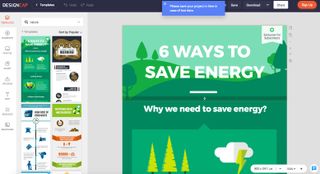
DesignCap is a free infographic maker that's simple to use and has a good range of templates – although you'll have to pay for some of the nicer ones. It also offers icons, illustrations and stock imagery, and the ability to upload your own should you want to. The free plan allows you up to five jpg exports, and you can upgrade to a basic plan ($4.99 p/mo) to get unlimited templates and high-res png and pdf exports.

07. MURAL
Specifications
Reasons to buy
Reasons to avoid
MURAL is designed for teams as a tool for project management, but it can also be used to create infographics. It allows colleagues to ideate with imagery and collaborate more efficiently, and looks great too. MURAL allows users to express ideas with smart inking on the Windows app, draw freely for a full whiteboard experience and share sticky note feedback with team members so everybody is kept in the loop with the progress of a project.
If your team needs to collaborate and share data in a visual way, MURAL could be the infographic maker for you. Pricing starts at $12 per month. There's a free trial.
08. Visme
Specifications
Reasons to buy
Reasons to avoid
Visme promises to help you 'speak visually'. You can use it to build presentations, but it's especially geared towards creating engaging infographics. This infographic maker includes over 100 fonts (for more, see our list of free fonts), millions of free images and thousands of quality icons, and there are options to include video and audio (including the ability to record a voiceover directly in the editor, which is handy). You can also animate your content to make things clearer.
What sets this tool apart from the rest on this list is that Visme allows users to whip up an infographic in a few minutes, thanks to a library of pre-made assets that can be easily dragged and dropped into place. This allows even non-designers to display their data visually. Visme also gives users the ability to create interactive and animated infographics, making their stats and figures sing like never before. Pricing starts from $15 a month, but there's a free version that can serve to get a feel for the software.
09. Biteable
Specifications
Reasons to buy
Reasons to avoid
Fancy something a little different? Biteable gives users the chance to create high-quality video infographics that can be shared on social media. As well as providing engaging image assets for creatives to work with, Biteable also offers soundtracks to really make your creations sing.
With plenty of designs and pre-made scenes at its disposal, this app removes the barrier to entry that so often stops people from using videos to their full effect. There's a range of plans available, the free plan enables you to make and share up to 10 video projects with the Biteable watermark. Paid plans start at $19 per month.
10. Google Charts
Specifications
Reasons to buy
Reasons to avoid
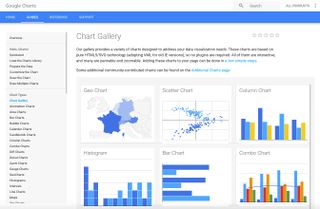
Google's chart tools are powerful, simple to use – and in this case its a completely free infographic maker tool. You can choose from a variety of charts and configure an extensive set of options to perfectly match the look and feel of your website. By connecting your data in real time, Google Charts is a straightforward infographic maker for your website.
11. Infogram
Specifications
Reasons to buy
Reasons to avoid
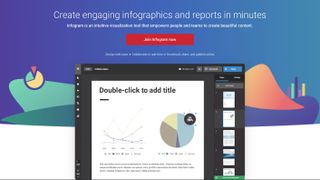
Infogram is a great tool with a wide variety of graphs, charts and maps as well as the ability to upload pictures and videos to create cool infographics. You enter and edit the data that makes up the infographic in an Excel-style tool, the contents of which are reflected in your design. The software will automatically change the look of the infographic to perfectly represent your data, too.
When you're happy with your infographic, you can publish it to the Infogram website for all to enjoy, embed it into your own website, or share it via social media. The basic version (up to 10 projects and 13 maps types) is free, while paid versions start from $19 per month.

12. Mind the Graph
Specifications
Reasons to buy
Reasons to avoid
Mind the Graph specialises in scientific infographics, but its tools can be used to create illustrations to complement most forms of data outside of scientific papers. The online infographic maker provides various infographic layouts that can be used straight out of the box to design many types of visual illustrations.
Mind the Graph provides thousands of icons that are useful for non-scientific purposes as well as for livening up a wordy journal paper, and you can take advantage of its built-in image editor and online updater to make changes on the fly. There's a free version suitable for trying out the software. The paid versions start as low as $5 for the Junior version aimed at undergraduate students and occasional users.
13. Kartograph
Specifications
Reasons to buy
Reasons to avoid
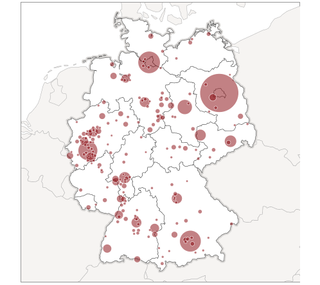
For a map-based free infographic maker, look no further than Kartograph. Kartograph is a free design tool that makes illustrative and interactive maps, created for the needs of designers and data journalists. The application doesn't require Google Maps or any other mapping service, making it a simple and lightweight framework – and there are a variety of map types to suit your needs.
It has Python and JavaScript-based tools to create the required maps. The Python library generates beautiful and compact SVG maps; while the JS library helps you to create interactive maps that run across all major browsers.
14. Easel.ly
Specifications
Reasons to buy
Reasons to avoid
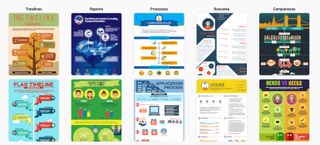
Web-based infographic maker Easel.ly offers you a range of templates to start you off, all of which are easily customisable (with limitations). You get access to a library of things like arrows, shapes and connector lines, and you can customise the text with different fonts, colours, text styles and sizes. The tool also lets you upload your own graphics and position them with one touch.
The free option includes 60 images and 10 fonts, or for $4 a month you get a much wider pool of resources, plus boosted security options and – if you need it – design help.

15. Adioma
Specifications
Reasons to buy
Reasons to avoid
Adioma offers users a range of generative templates: you pick a basic template (such as timeline, grid, or cycle), then the infographics build themselves around the text you supply, and adjust as you add or remove information. That means you don't have to spend time adjusting and realigning your infographic. There's also a template-switching feature that enables you to compare how the same data would look in different formats.
This infographic maker includes a range of templates, but what sets it apart is its large library of icons (you can also upload your own). The more expensive options include an expanded resource library, improved download options and the ability to upload more of your own content. It's free to try for one week. It is rather pricey, starting at $39 per month.
16. PicMonkey
Specifications
Reasons to buy
Reasons to avoid
PicMonkey is an online image editor with a section dedicated to designing infographics. Choose from the selection of templates, and customise the content with PicMonkey's library or by uploading your own images. There's also a selection of tutorials to help you out, focusing on things like how to design an infographic tailored to sharing on social media, and how to use grid theory to create a polished design. Pricing starts at $7.99 per month. There's a seven-day free trial available.
Related articles:
- How to download Photoshop
- How to download InDesign
- The 14 best Photoshop alternatives

Thank you for reading 5 articles this month* Join now for unlimited access
Enjoy your first month for just £1 / $1 / €1
*Read 5 free articles per month without a subscription

Join now for unlimited access
Try first month for just £1 / $1 / €1
Craig Stewart is a writer, SEO strategist and content marketer, and is a former editor of Creative Bloq. Craig has written about design, typography, tech and football for publications including Creative Bloq, T3, FourFourTwo and DSG, and he has written a book on motoring for Haynes. When he's not writing, you'll usually find Craig under his old car learning about DIY repairs the hard way.
- Daniel JohnDesign Editor


