35 incredible dataviz tools
Take the hard work out of creating charts and infographics with these tools.
Data isn't a thing that's easy for the average person to grasp. While some can look through a spreadsheet and instinctively find the information they need within a mass of figures, the rest of us need a little help, and that's where data visualisation can be a real help.
For the designer, the challenge is not only in rendering a set of data in an informative way, but also in presenting it so that it that stands out from the mass of competing data streams.
One of the best ways to get your message across is to use a visualisation to quickly draw attention to the key messages, and by presenting data visually, it's also possible to uncover surprising patterns and observations that wouldn't be apparent from looking at stats alone. And nowadays, there's plenty of free graphic design software to help you do just that.
As author, data journalist and information designer David McCandless said in his TED talk: "By visualising information, we turn it into a landscape that you can explore with your eyes, a sort of information map. And when you're lost in information, an information map is kind of useful."
There are many different ways of telling a story, but everything starts with an idea. So to help you get started we've rounded up some of the most awesome data visualisation tools available on the web.
01. Chart Studio

Make charts, presentations and dashboards with this flexible software. You can perform your analysis using JavaScript, Puthon, R, Matlab, Jupyter or Excel, and there are several options for importing data. The visualisation library and online chart creation tool allow you to make great-looking graphics.
02. DataHero

DataHero enables you to pull together data from cloud services and create charts and dashboards. No technical abilities are required, so this is a great tool for your whole team to use.
Get the Creative Bloq Newsletter
Daily design news, reviews, how-tos and more, as picked by the editors.
03. Chart.js
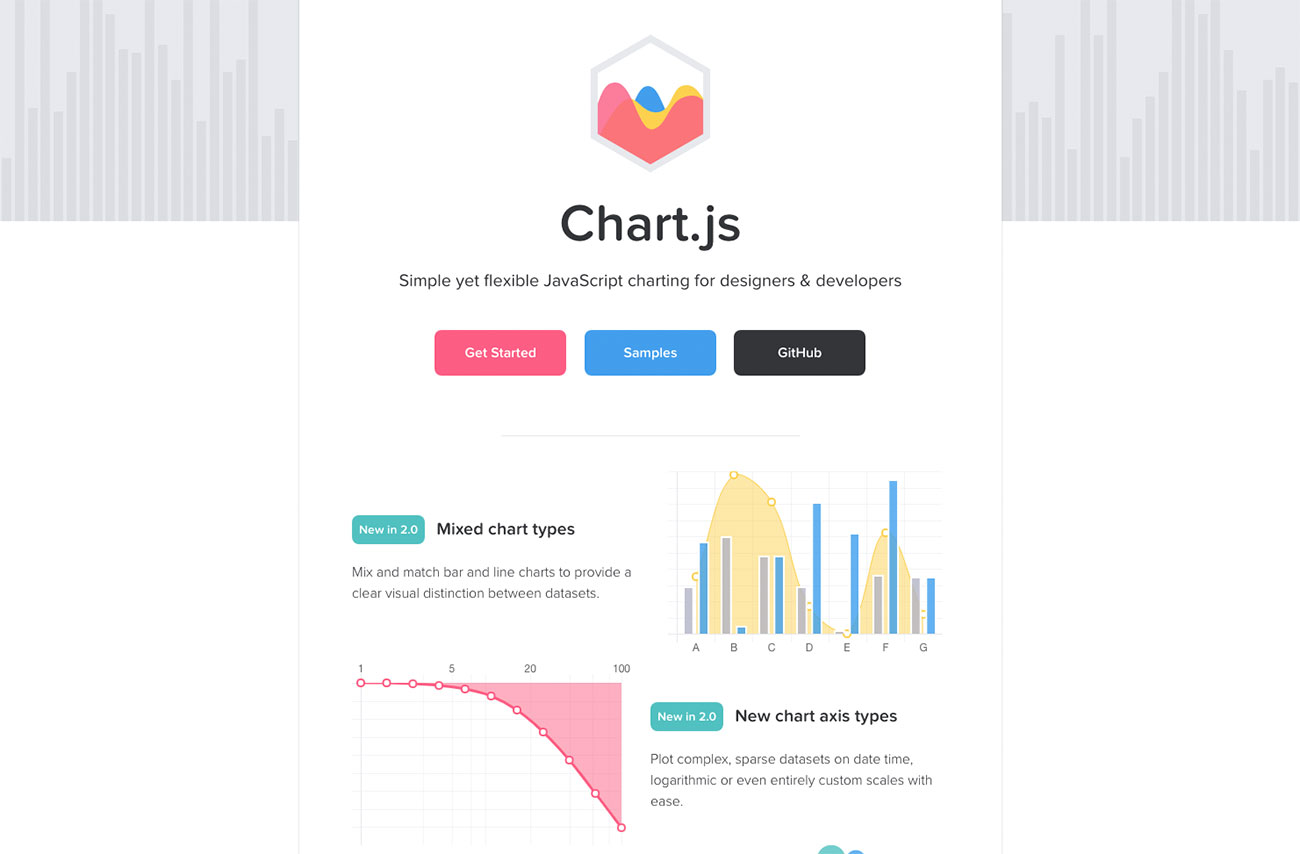
Although armed with only six chart types, open source library Chart.js is the perfect data visualisation tool for hobbies and small projects. Using HTML 5 canvas elements to render charts, Chart.js creates responsive, flat designs, and is quickly becoming one of the most poplar open-source charting libraries. Read more about how to use Chart.js here.
04. Tableau
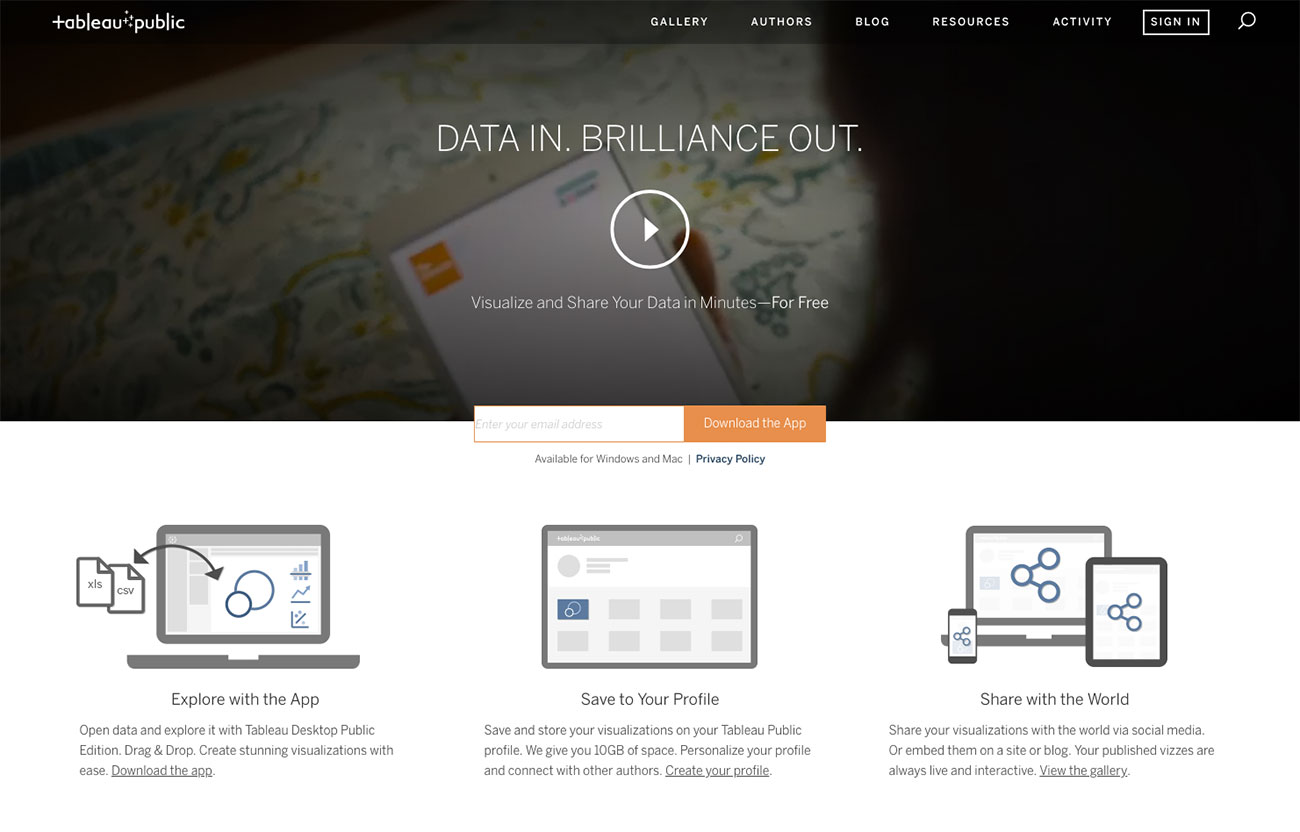
Packed with graphs, charts, maps and more, Tableau Public is a popular data visualisation tool that's also completely free. Users can easily drag and drop data into the system and watch it update in real-time, plus you can collaborate with other team members for quick project turnaround.
05. RAWGraphs
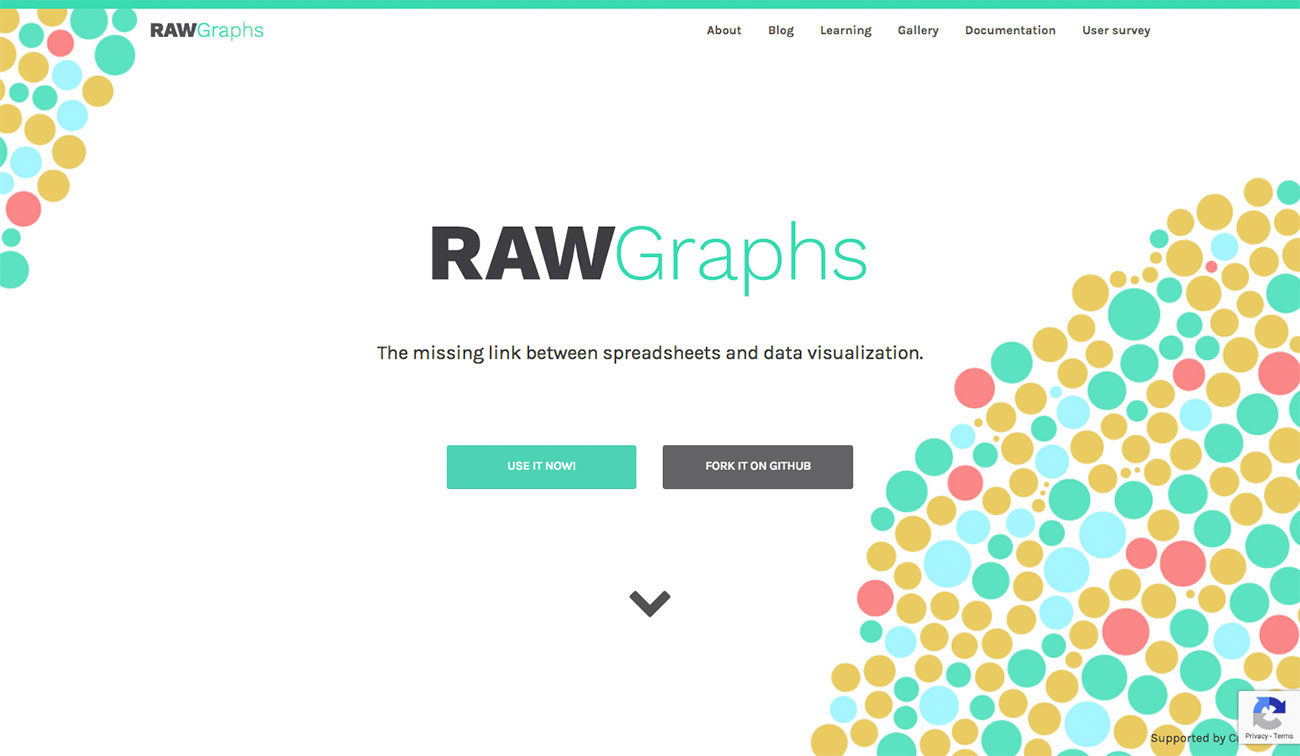
Open, customisable, and free to download and modify, RAWGraphs lets users create vector-based data visualisations. Data can be safely uploaded from apps to computers, plus it can be exported as an SVG or PNG and embedded in your webpage.
06. Dygraphs
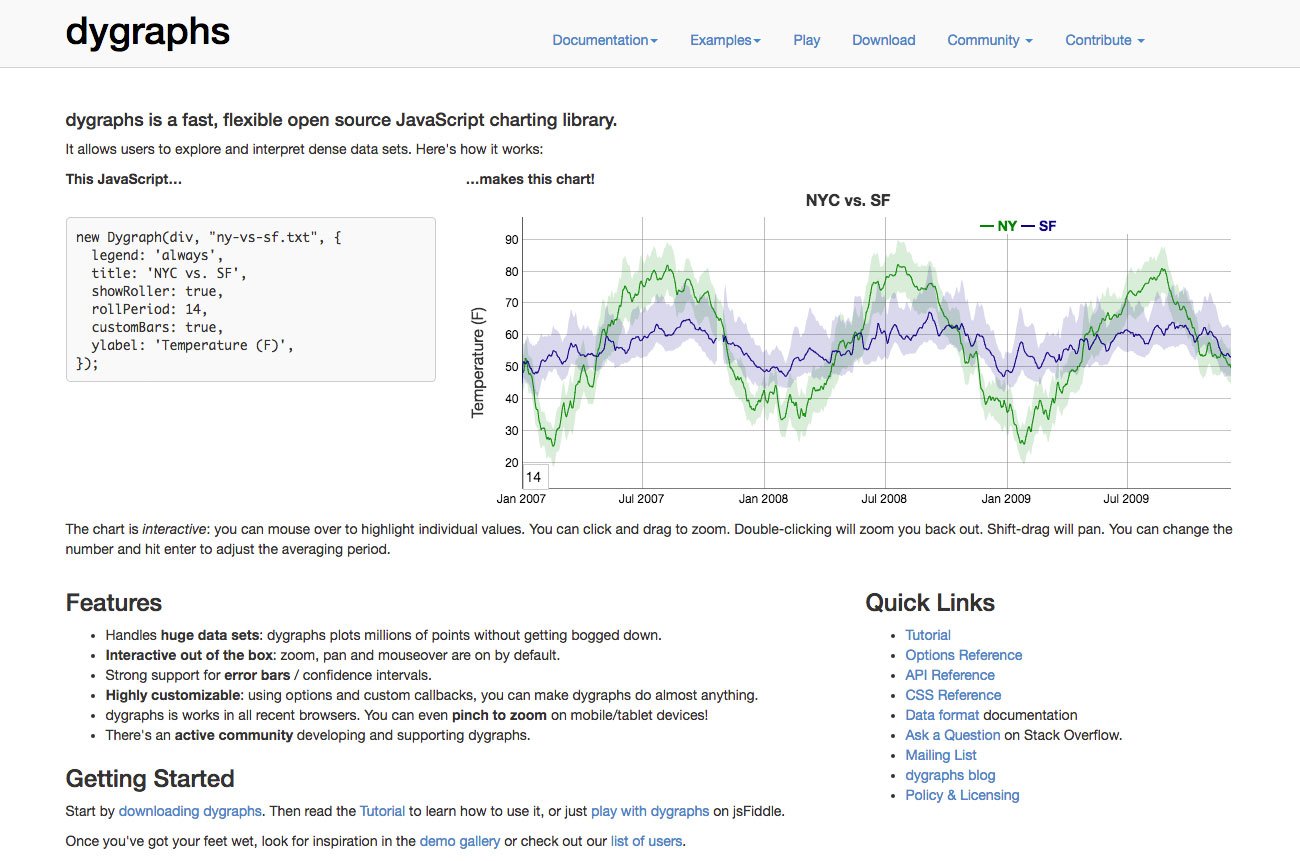
Dygraphs is a fast, flexible open source JavaScript charting library that allows users to explore and interpret dense data sets. It's highly customisable, works in all major browsers, and you can even pinch to zoom on mobile and tablet devices.
07. ZingChart
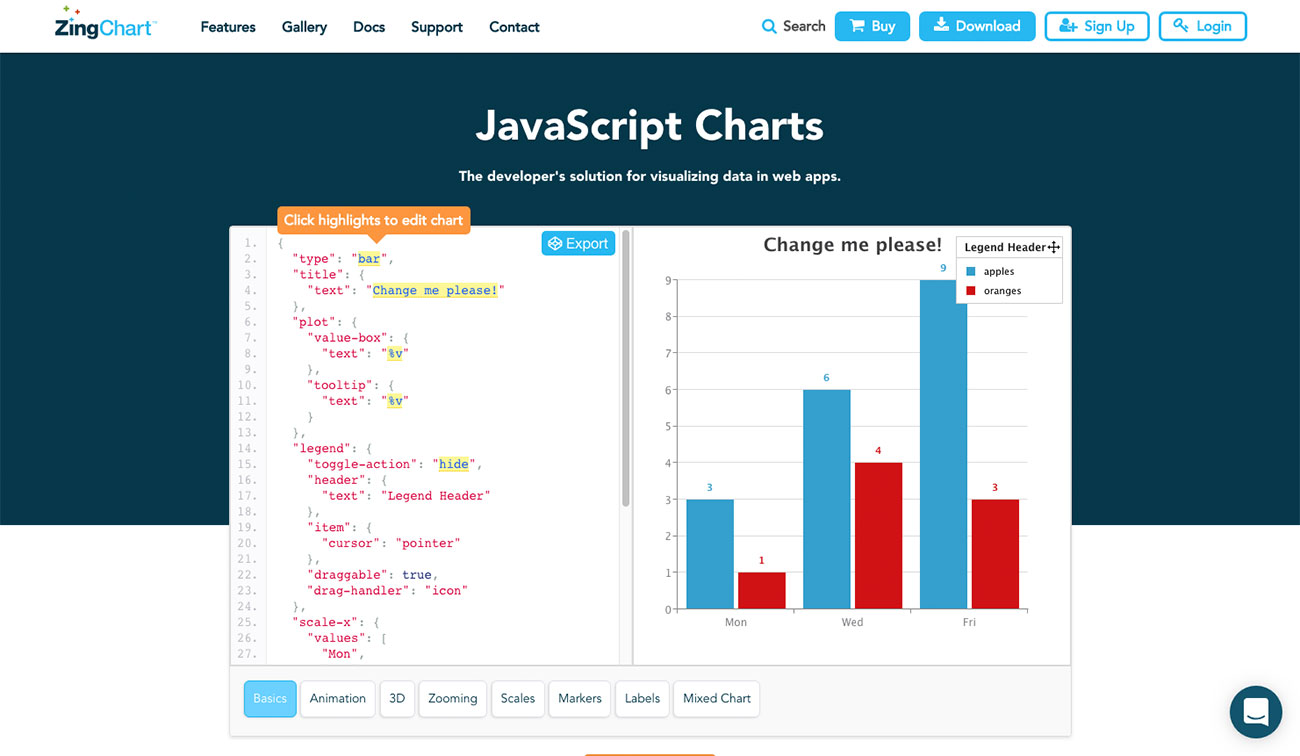
ZingChart is a JavaScript charting library and feature-rich API set that lets you build interactive Flash or HTML5 charts. It offers over 100 chart types to fit your data.
08. InstantAtlas
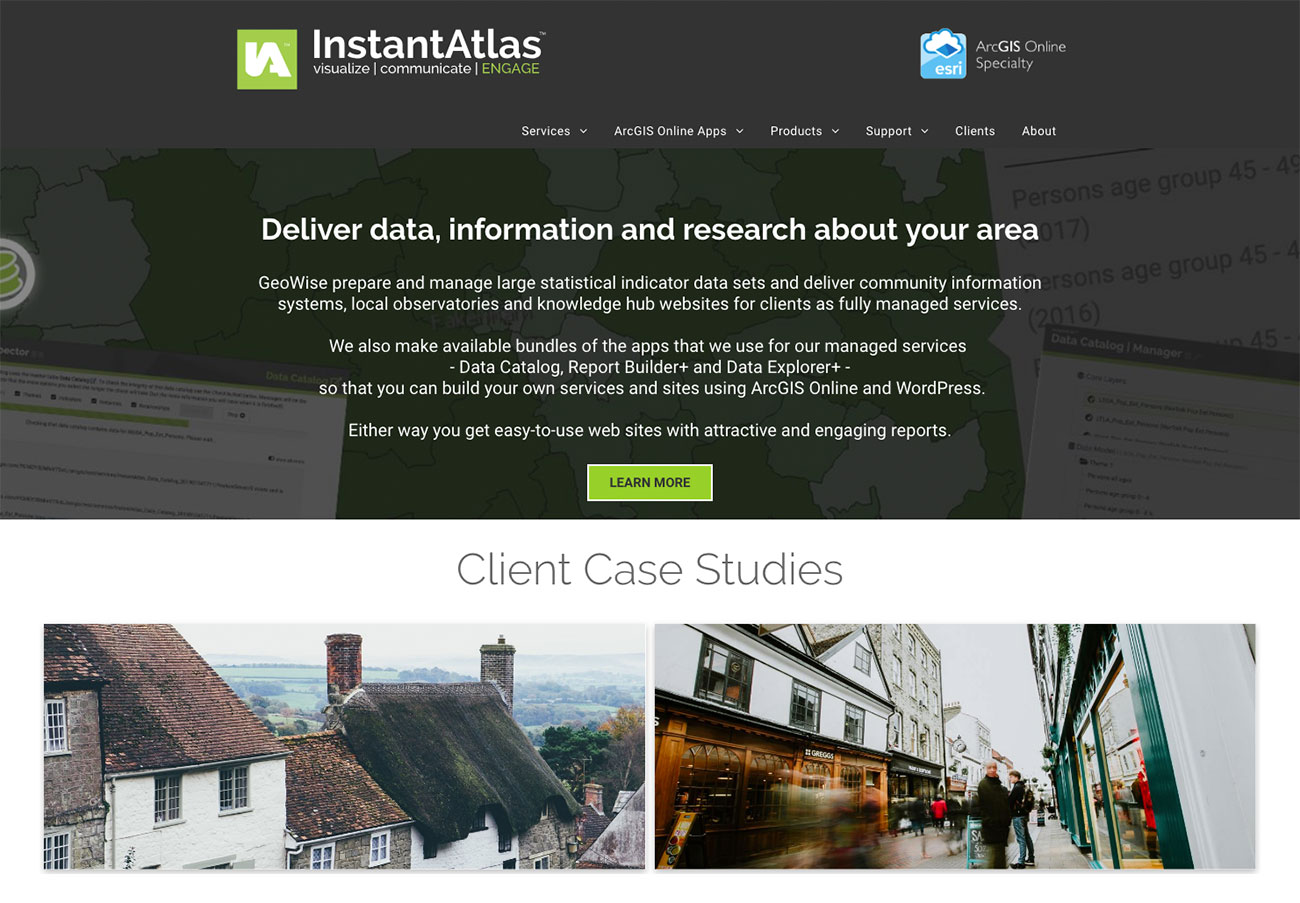
If you're looking for a data viz tool with mapping, InstantAtlas is worth checking out. This tool enables you to create highly-interactive dynamic and profile reports that combine statistics and map data to create engaging data visualisations.
09. Modest Maps
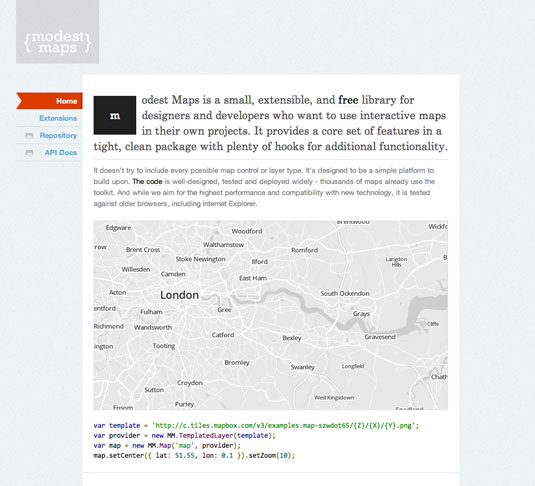
Modest Maps is a lightweight, simple mapping tool for web designers that makes it easy to integrate and develop interactive maps within your site, using them as a data visualisation tool.
The API is easy to get to grips with, and offers a useful number of hooks for adding your own interaction code, making it a good choice for designers looking to fully customise their user's experience to match their website or web app. The basic library can also be extended with additional plugins, adding to its core functionality and offering some very useful data integration options.
10. Leaflet
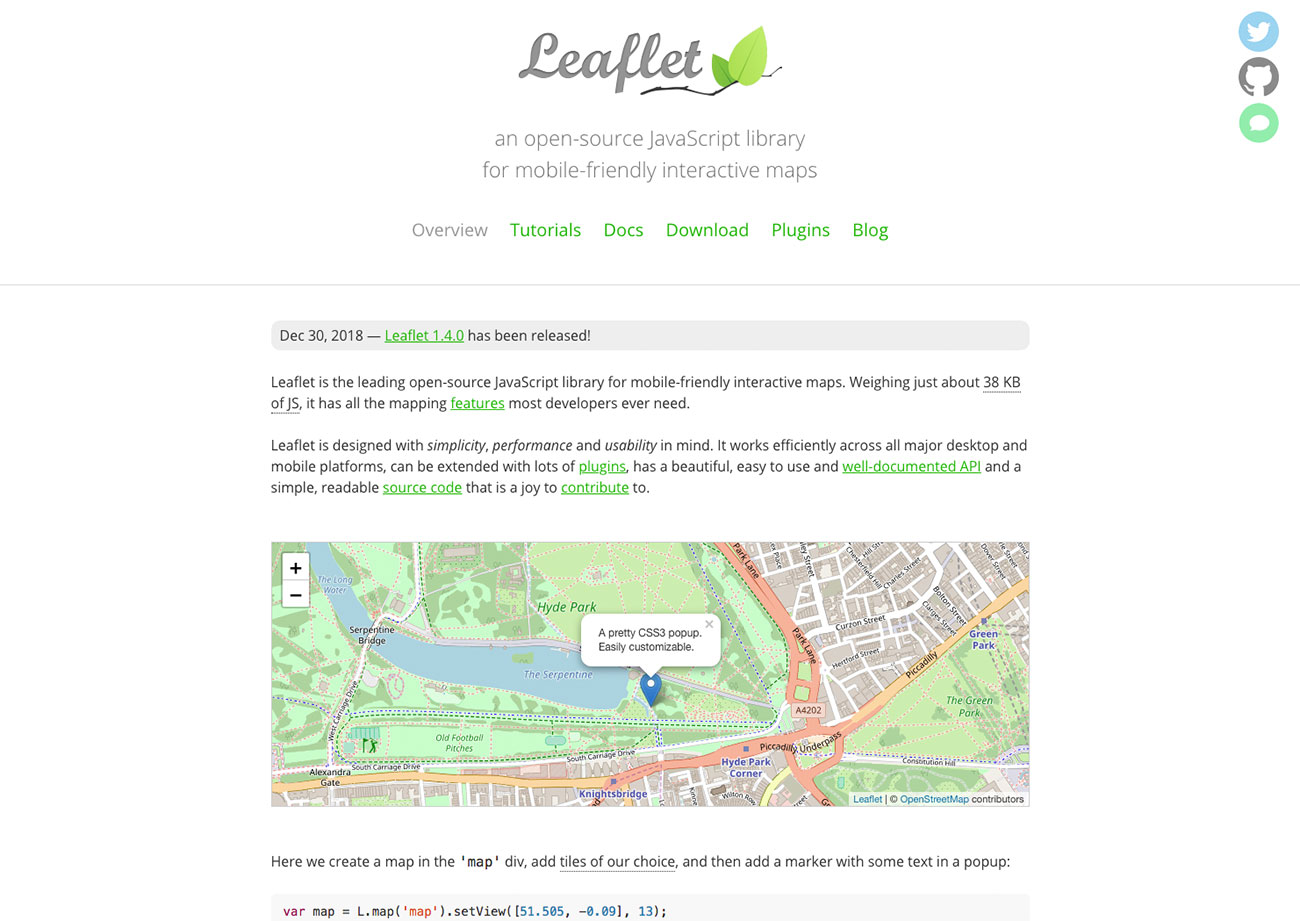
Another mapping tool, Leaflet makes it easy to use OpenStreetMap data and integrate fully interactive data visualisation in an HTML5/CSS3 wrapper.
The core library itself is very small, but there are a wide range of plugins available that extend the functionality with specialist functionality, such as animated markers, masks and heatmaps. It's perfect for any project where you need to show data overlaid on a geographical projection.
11. WolframAlpha
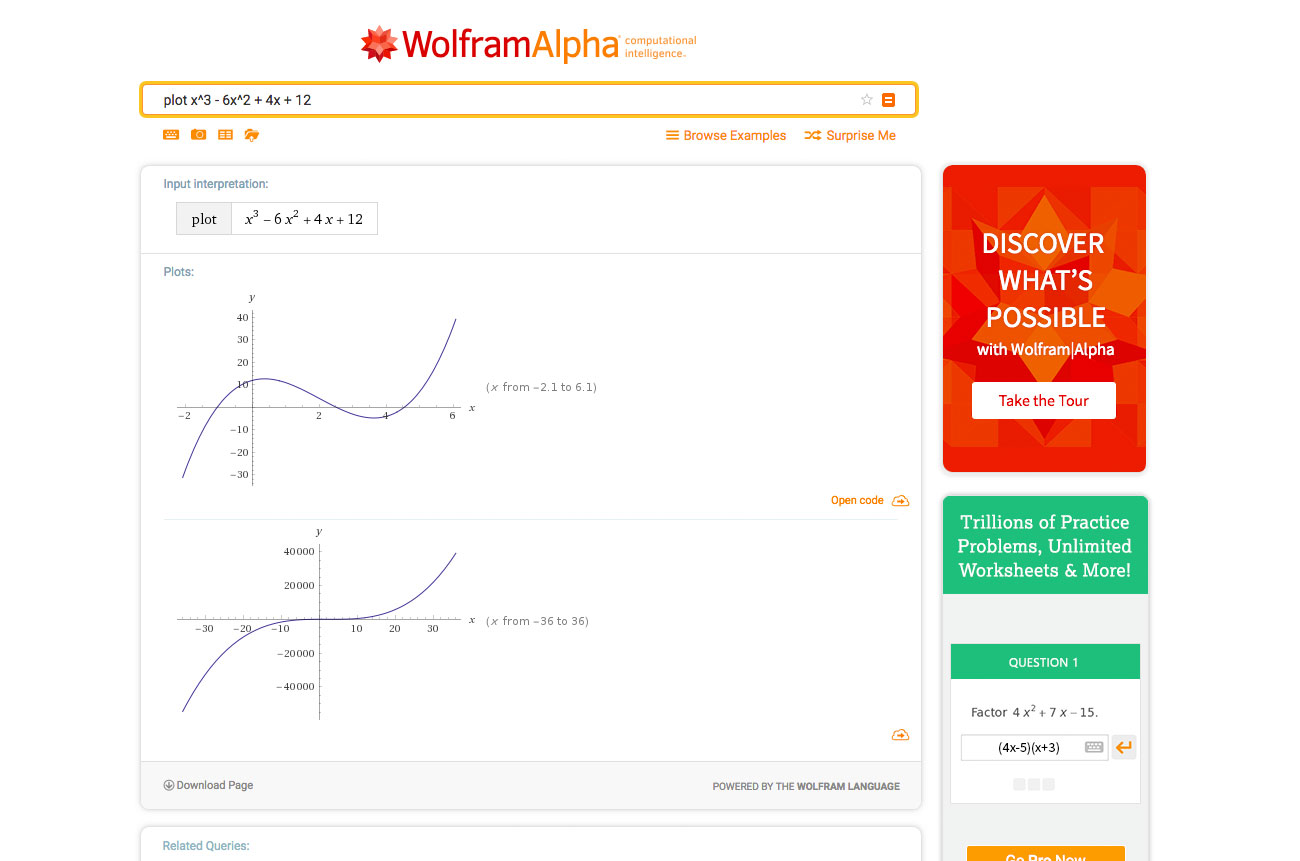
Billed as a "computational knowledge engine", the Google rival WolframAlpha is really good at intelligently displaying charts in response to data queries, without the need for any configuration. If you're using publicly available data, this offers a simple widget builder to make it really simple to get visualisations on your site.
12. Visualize Free

Visualize Free is a hosted tool that allows you to use publicly available datasets, or upload your own, and build interactive visualisations to illustrate the data. The visualisations go well beyond simple charts, and the service is completely free, plus while development work requires Flash, output can be done through HTML5.
13. Better World Flux
Orientated towards making positive change to the world, Better World Flux has some lovely visualisations of some pretty depressing data. It would be very useful, for example, if you were writing an article about world poverty, child undernourishment or access to clean water. This tool doesn't allow you to upload your own data, but does offer a rich interactive output.
14. FusionCharts
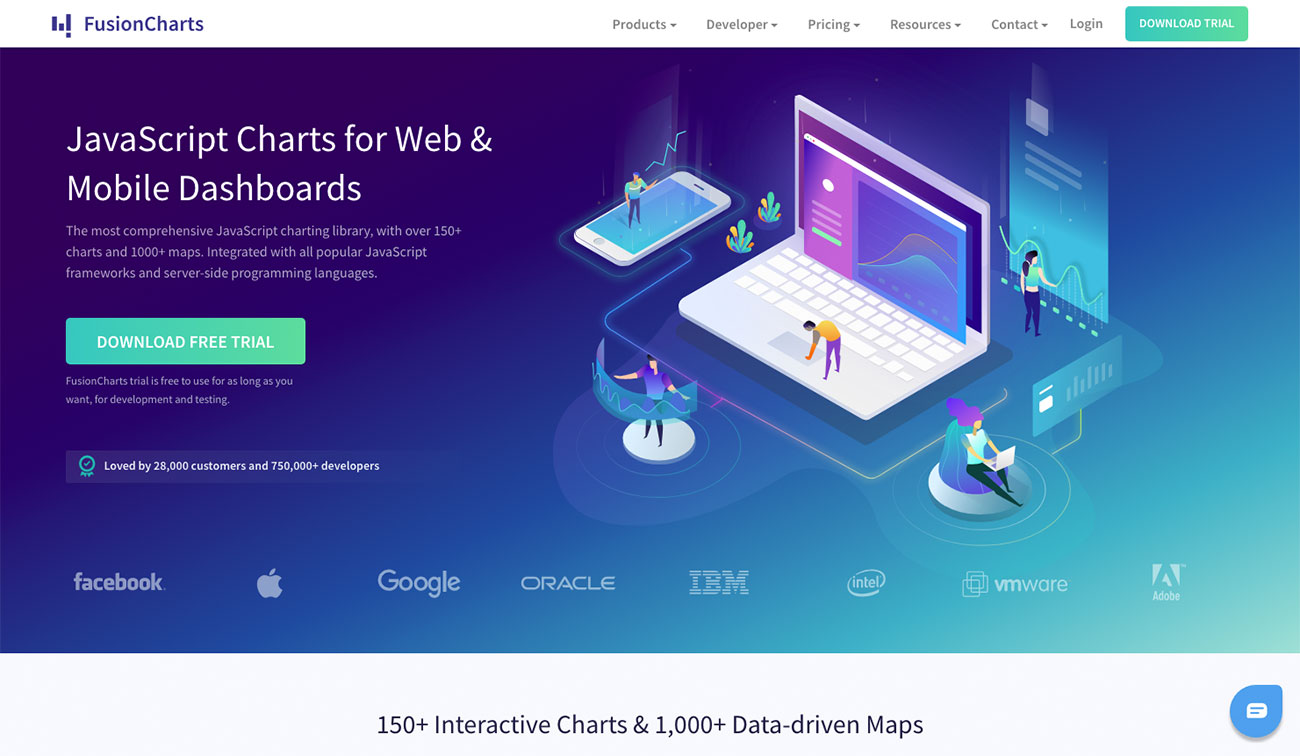
FusionCharts Suite XT brings you 90+ charts and gauges, 965 data-driven maps, and ready-made business dashboards and demos. FusionCharts comes with extensive JavaScript API that makes it easy to integrate it with any AJAX application or JavaScript framework. These charts, maps and dashboards are highly interactive, customisable and work across all devices and platforms.
15. jqPlot
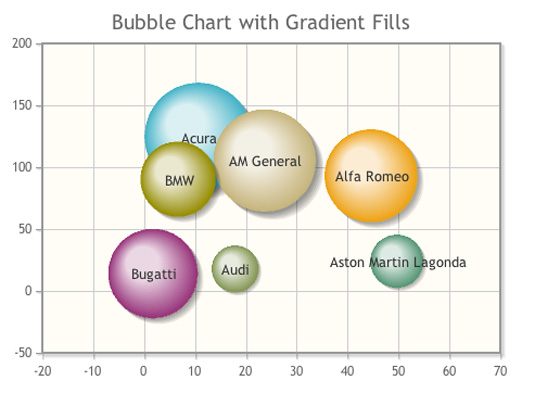
Another jQuery plugin, jqPlot is a nice solution for line and point charts. It comes with a few nice additional features such as the ability to generate trend lines automatically, and interactive points that can be adjusted by the website visitor, updating the dataset accordingly.
16. D3.js
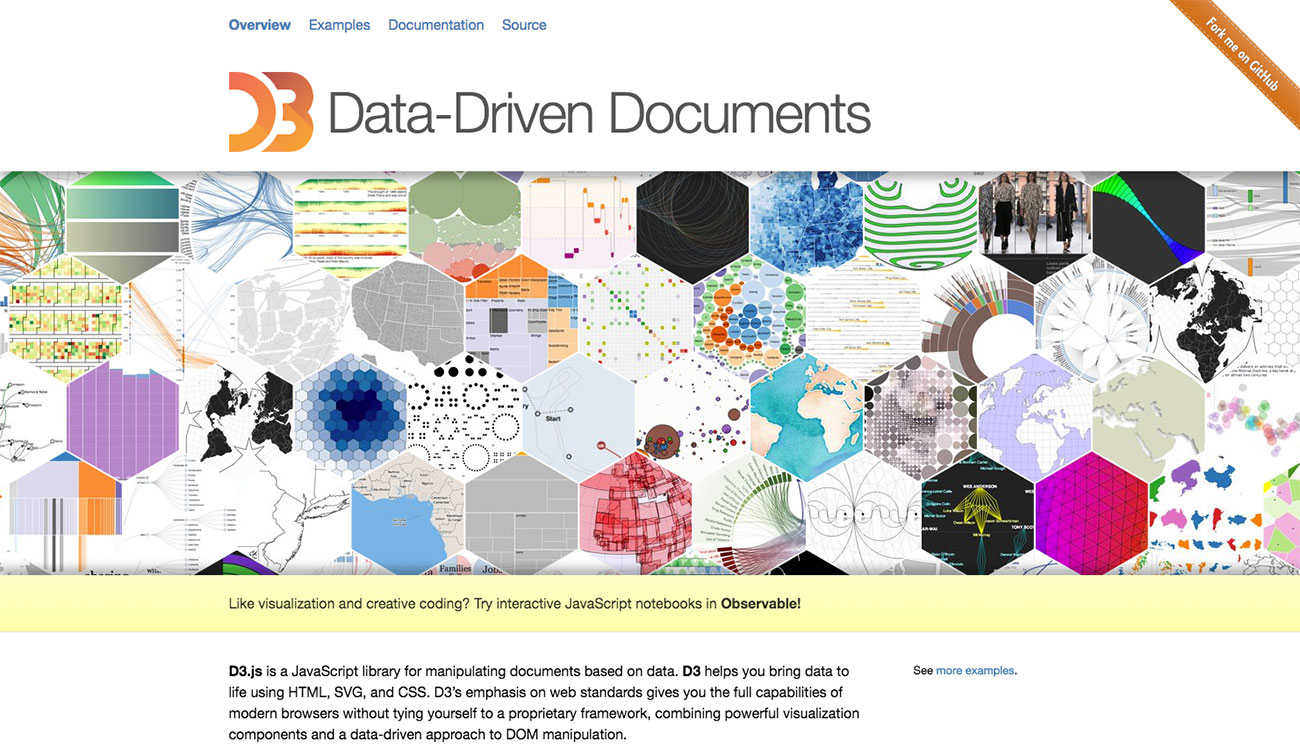
D3.js is a JavaScript library that uses HTML, SVG, and CSS to render some amazing diagrams and charts from a variety of data sources. This library, more than most, is capable of some seriously advanced visualisations with complex data sets. It's open source, and uses web standards so is very accessible. It also includes some fantastic user interaction support.
17. JavaScript InfoVis Toolkit
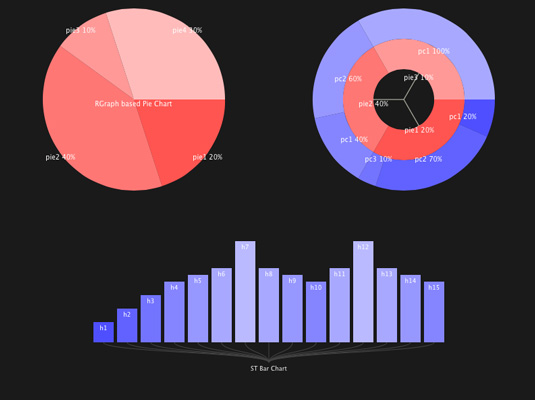
A fantastic library written by Nicolas Belmonte, the JavaScript InfoVis Toolkit includes a modular structure, allowing you to only force visitors to download what's absolutely necessary to display your chosen data visualisations. This library has a number of unique styles and swish animation effects, and is free to use (although donations are encouraged).
Next page: More top tools for data visualisation...

Thank you for reading 5 articles this month* Join now for unlimited access
Enjoy your first month for just £1 / $1 / €1
*Read 5 free articles per month without a subscription

Join now for unlimited access
Try first month for just £1 / $1 / €1
